10-10-10 Challenge - Stock Chart Analysis vs. Quantitative Trading
Apr 27, 2021
Thanks to all who participated in our challenge! We plan to run this again on a much bigger scale, so this was our first attempt, and your involvement has been greatly appreciated.
The Challenge
The goal of the contest was to see how well a group of chart readers can perform and see if StockOdds data can compete with skilled technical traders.
The insights are interesting, and we will showcase this, so you have some takeaways from it.
The Setup
First off, our team knew we were severely handicapped in this contest, so our restrictions and limitations that disadvantaged us are as follows:
StockOdds |
Chart Readers |
|---|---|
|
No checking news of any kind. |
Allowed to check news. |
|
No macro adjustments. |
Allowed to consider macro environment. |
|
No looking at charts for markets or any symbols. |
Chart based focus. |
|
No looking at Indicators, just used screener within StockOdds database. |
Allowed to use indicators of any kind. |
|
No qualifying sentiment in any industry or sector |
Allowed to consider sentiment, money flow. |
|
We selected our symbols on the previous day as soon as database update was completed. |
Allowed to submit Long or Short choices up to 30 minutes before the next day (deadline 9:00am ET) |
|
No adjusting orders for fair value, the implied open, stocks gapping or pre-market conditions for any of the days. |
No adjusting orders for fair value, the implied open, stocks gapping or pre-market conditions for any of the days. |
|
No adjusting for betas, volatilities, ATR’s, fundamentals, earnings, dividends, corporate actions, or any other metrics. |
Could consider implications of any of these factors on the direction of the stocks and select Long or Short accordingly. |
|
We selected 5 longs and 5 shorts each and every day of the contest. |
Had no such restriction. They could have selected long on all 10 symbols if they wanted to. |
|
Market Orders at Open and Close. |
Had the same focus: Open to Close. |
|
We traded these selections live, exactly as chosen with $5000 of capital per symbol based on previous days close price using market orders. (no adjustments) |
Participants were selecting on paper only. |
As you can see from the rules of the contest, that we gave the Chart Readers more than a fighting chance to win this competition against static data, with very little human discretion. Now, we know it is an additional degree of difficulty to figure out Open to Close direction, as the stock chosen Long might gap up and pull back after the open, or with a stock chosen Short, might gap down and then retrace.
StockOdds' Trading Strategy
From a trading framework for Long/Short baskets, we normally follow these rules:
- We try to be long/short capital balanced as well as ATR or volatility balanced across our symbols.
- Example: if one stock (ABC) has a price of $100.00 and an ATR of $3.00/day and another stock (XYZ) in our list has a price of $100.00 but an ATR of only $1.00/day then to put $5000.00 of capital on each of these stocks can cause variance.
- Example: if Long ABC goes against you would produce a loss of $150.00. If Short XYZ which goes in your favor would produce $50.00 of profit, so hardly “normalized”.
- We can consider direction of market and utilize beta balancing to account for better capital utilization.
Note: the starting point of a quantitative trader’s journey is very different than the ultimate goal. In this contest, we showcased what is available to most traders without being rocket scientists in their methods.
One can start with market orders, utilizing equal capital allocation for all symbols, but then if committed to the journey of learning, growing, and optimizing, one will seek the best Return on Capital (ROC) and lowest variance, which boils down to managing risk better.
- We try and note premarket conditions and look at the implied open of the markets.
- Example: Opening down 5% is very different than a flat open and we have to adjust for this.
- We use Limit Orders, where we define the price that we are willing to participate according to the implied open for each stock. This comes from the difference between the Futures pre-market and the previous day’s cash close of the SP500. Fair Value adjusted implied opens can be calculated on the DOW, Russell, Nasdaq and SP500.
- We do check for news, especially around earnings seasons as business as usual is what we seek, not a major disruption to our statistical approach. Earnings are fundamental catalysts, not statistical.
- Rather than doing a balanced entry of 5 longs and 5 shorts each day, we could be long 30 symbols and only short the SPY, or we can pair off symbols in the same sector, or we could utilize long a sector against short another sector. The more symbols the smoother the performance.
- We can employ multiple strategies and line up multiple ducks of signals within those strategies
- We can look at money flow, sentiment, macro forces, and observe charts.
- We could look at a tiered approach, some capital at open and some after open when market provides information.
- Participating at the open but letting the market do its thing providing insights into which stocks are weak and which are strong.
With all that being said, what happened this past 10 days? Who won the contest? Patience is a virtue :)
The Results
The winner is the one who correctly selected the most symbols direction from Open to Close.
10 symbols a day for 10 days = 100 symbols
So looking at selections and results for each symbol:
First Place - StockOdds: 53 out of 100 correct
Second Place - Chart Reader: 52 out of 100 correct
Third Place - Chart Reader: 49 out of 100 correct
Fourth Place - Chart Reader: 45 out of 100 correct
Fifth Place - Chart Reader: 41 out of 100 correct
So, what did StockOdds selections actually return? $719.65 which is 0.142% return on capital (ROC) every day, which is inclusive of wins, losses and costs. Annualized, these returns equate to $71,595 and 43.2% per year.
Only 53% of the trades correct and performed ok. The Second Place Chart Reader just slightly underperformed StockOdds on dollars earned. All other Chart Readers didn’t fare so well.
Compared to the traders who participated in this study, StockOdds was at least 10% more accurate than the average technical chart reader. When is comes to trading, being slightly more accurate is sometimes the difference between having profitability or not. Compared to the average technical chart reader, StockOdds was at least 450% more profitable in this case.
Could StockOdds Have Done Even Better?
Yes, we used RSI (2-period) as our indicator looking for mean reverting price action. The beginning of April continued on the back of March with a strong month-end Seasonality and trend, and normally we would couple that context to our other screens, but in this contest, we kept things a bit too simple and as explained earlier, had significant handicaps. We feel we got run over in the first 5 days of the contest but recovered in the last 5 days.
This contest does showcase that technical analysis takes more time to conduct then running a screener from StockOdds and is not accurate 100% of the time, but closer to 50% of the time.
StockOdds indicators and subsequent outcomes are probabilistic in nature and we find they can perform at scale. A chart reader would be hard pressed to trade 500+ symbols a day, but we interact with data-driven basket traders doing exactly that. The quantitative approach is significantly more compoundable, and we have comments about how relaxing this style of stock trading is. Let the data do the heavy lifting for you, but know the hard work comes first in finding and proving a positive expectation for each trade.
How This Compares to The Average Trader
There are several trading "rules" that have been spread that the average trader ends up following. We are here to show these are actually fallacies:
- Most traders should aim to have a 70/30 win/loss ratio
- It is possible to have many different win/loss ratios while also being profitable. It is actually the expected value (EV) formula that should be used.
- Trading high volatility growth stocks is better than trading boring more predictable names
- Boring, even though volatility isn't as high, can be more predictable
- Risking $1 to make $10 means one will be successful
- This risk to reward is flawed. It is actually the EV formula that is essential.
- If traders hedge, they reduce winnings
- This may be true on a case-by-case basis, but if you don't hedge, you increase your losses, which severely impacts profitability in the long run.
- If you have one losing day that wipes out a week of gains...how much farther did you get?
Being hedged by having both longs and shorts in a single basket of stocks, and using an EV formula, instead of primarily focusing on other statistics such as a win/loss ratio, can produce successful results for traders over the long sample. Though daily gains are usually smaller, this can produce consistent growth which compounds over time.
Over decades of trading, I have witnessed these 3 benchmarks for performance:
- 0.1% ROC per day on absolute value of capital deployed, including wins/losses
- 1¢ per share traded, net
- 1 ATR per pair per week
These benchmarks are common in professional trading circles, and we can use these to evaluate how well we are doing.
Let’s shift gears now to some examples.
Analyses & Comments
April 12, pre-market
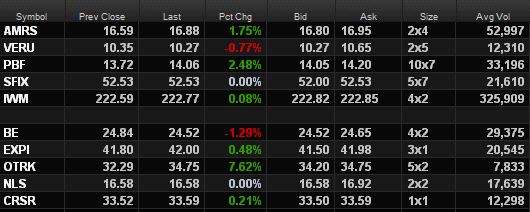
These were the selections for April 12. The top 5 are the Short Symbols and the bottom 5 are the Long Symbols.
This is pre-market before the 9:30am ET market opening. See the issue?
In a normal trading framework, we would NOT want to place a market order for the opening auction on OTRK. I don’t want to pay up 7.62%, but rather want to be in the liquidity providing game…not speculation. But this was the contest rules, so I risked real money to follow what we had specified.
Here are the results throughout the day:
April 12, 11:15am ET

April 12, 3:15pm ET
After the open the P&L was quite red, then improved throughout the day (again…not by intraday trading it, as we are Open to Close), but just the baskets chugging along with the subsequent behavior intended.

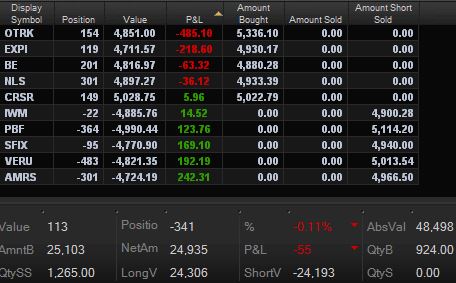
April 12, after market close
The 4pm close left us with $201.00 which was 0.40% ROC for the day.
Look at the massive loss from OTRK which would never have happened under a LIMIT ORDER process. If you are starting out with market orders and have planned to do some symbols and then observe pre-market conditions like we did on OTRK, then remove that symbol from your list.
Now to be fair, check out the PBF symbol. This was indicated to open up 2.48% which makes for a great short as we want to sell premium, and it dropped nicely.

April 14, 11:25am ET
Some day when you are trading you will have great ROC midday as shown above. Should you take the profit? If our benchmark is 0.1% ROC after all wins/losses, then that would incorporate some really great days of .6 .8 or even over 1%.
The best thing you can do as a new trader is to be systematic and not try too many discretionary decisions. If you ever do, then track the results. Did you make it better or worse for your human involvement?
As it was in this case, I left it according to the contest plan and this was the final end of day results:

April 14, after market close
The drop from late morning to end of the day close was more than half ending at 0.462% ROC, still above our benchmark.
You will have days that are down to start with (moreso if you are doing market orders) but you may finish in the green. Take it all in stride!

April 13, 9:36am ET
Just after the open, this is the mess I saw. If I closed everything, that action would have locked in 100% guaranteed loss. If I keep things on, there is a potential to finish better. But, probability is the goal, not possibility. So, I have to stick with the Odds that were selected for Open to Close.

April 13, after market close
It improved steadily throughout the day and finished at the market close up 0.464% ROC.
From these examples, you can see that we deal with various scenarios and there are reversals from the low, reversals from the high, some days are green, some days are red. The goal is the edge working over the long sample.
What This Means Long Term
Let’s examine what could happen with a consistent equity curve from making 0.1% per day which is my stated benchmark.
If you started out with 100K of capital being used per day, then at that run rate, you would make $100 per day on average after all wins, losses, and commissions.
If you continued this for 6 months or 125 Trading days, you would have built your capital up by $12,500.
If for the next 6 months you increased to 250K of capital per day, then you would make $31,250.
Another 6 months at 500K of capital per day = $62,500.
Consistent gains far outpace home runs, then big losses, bleeding out from trade after trade with a negative expectation.
Trading Careers with Sustainable Growth
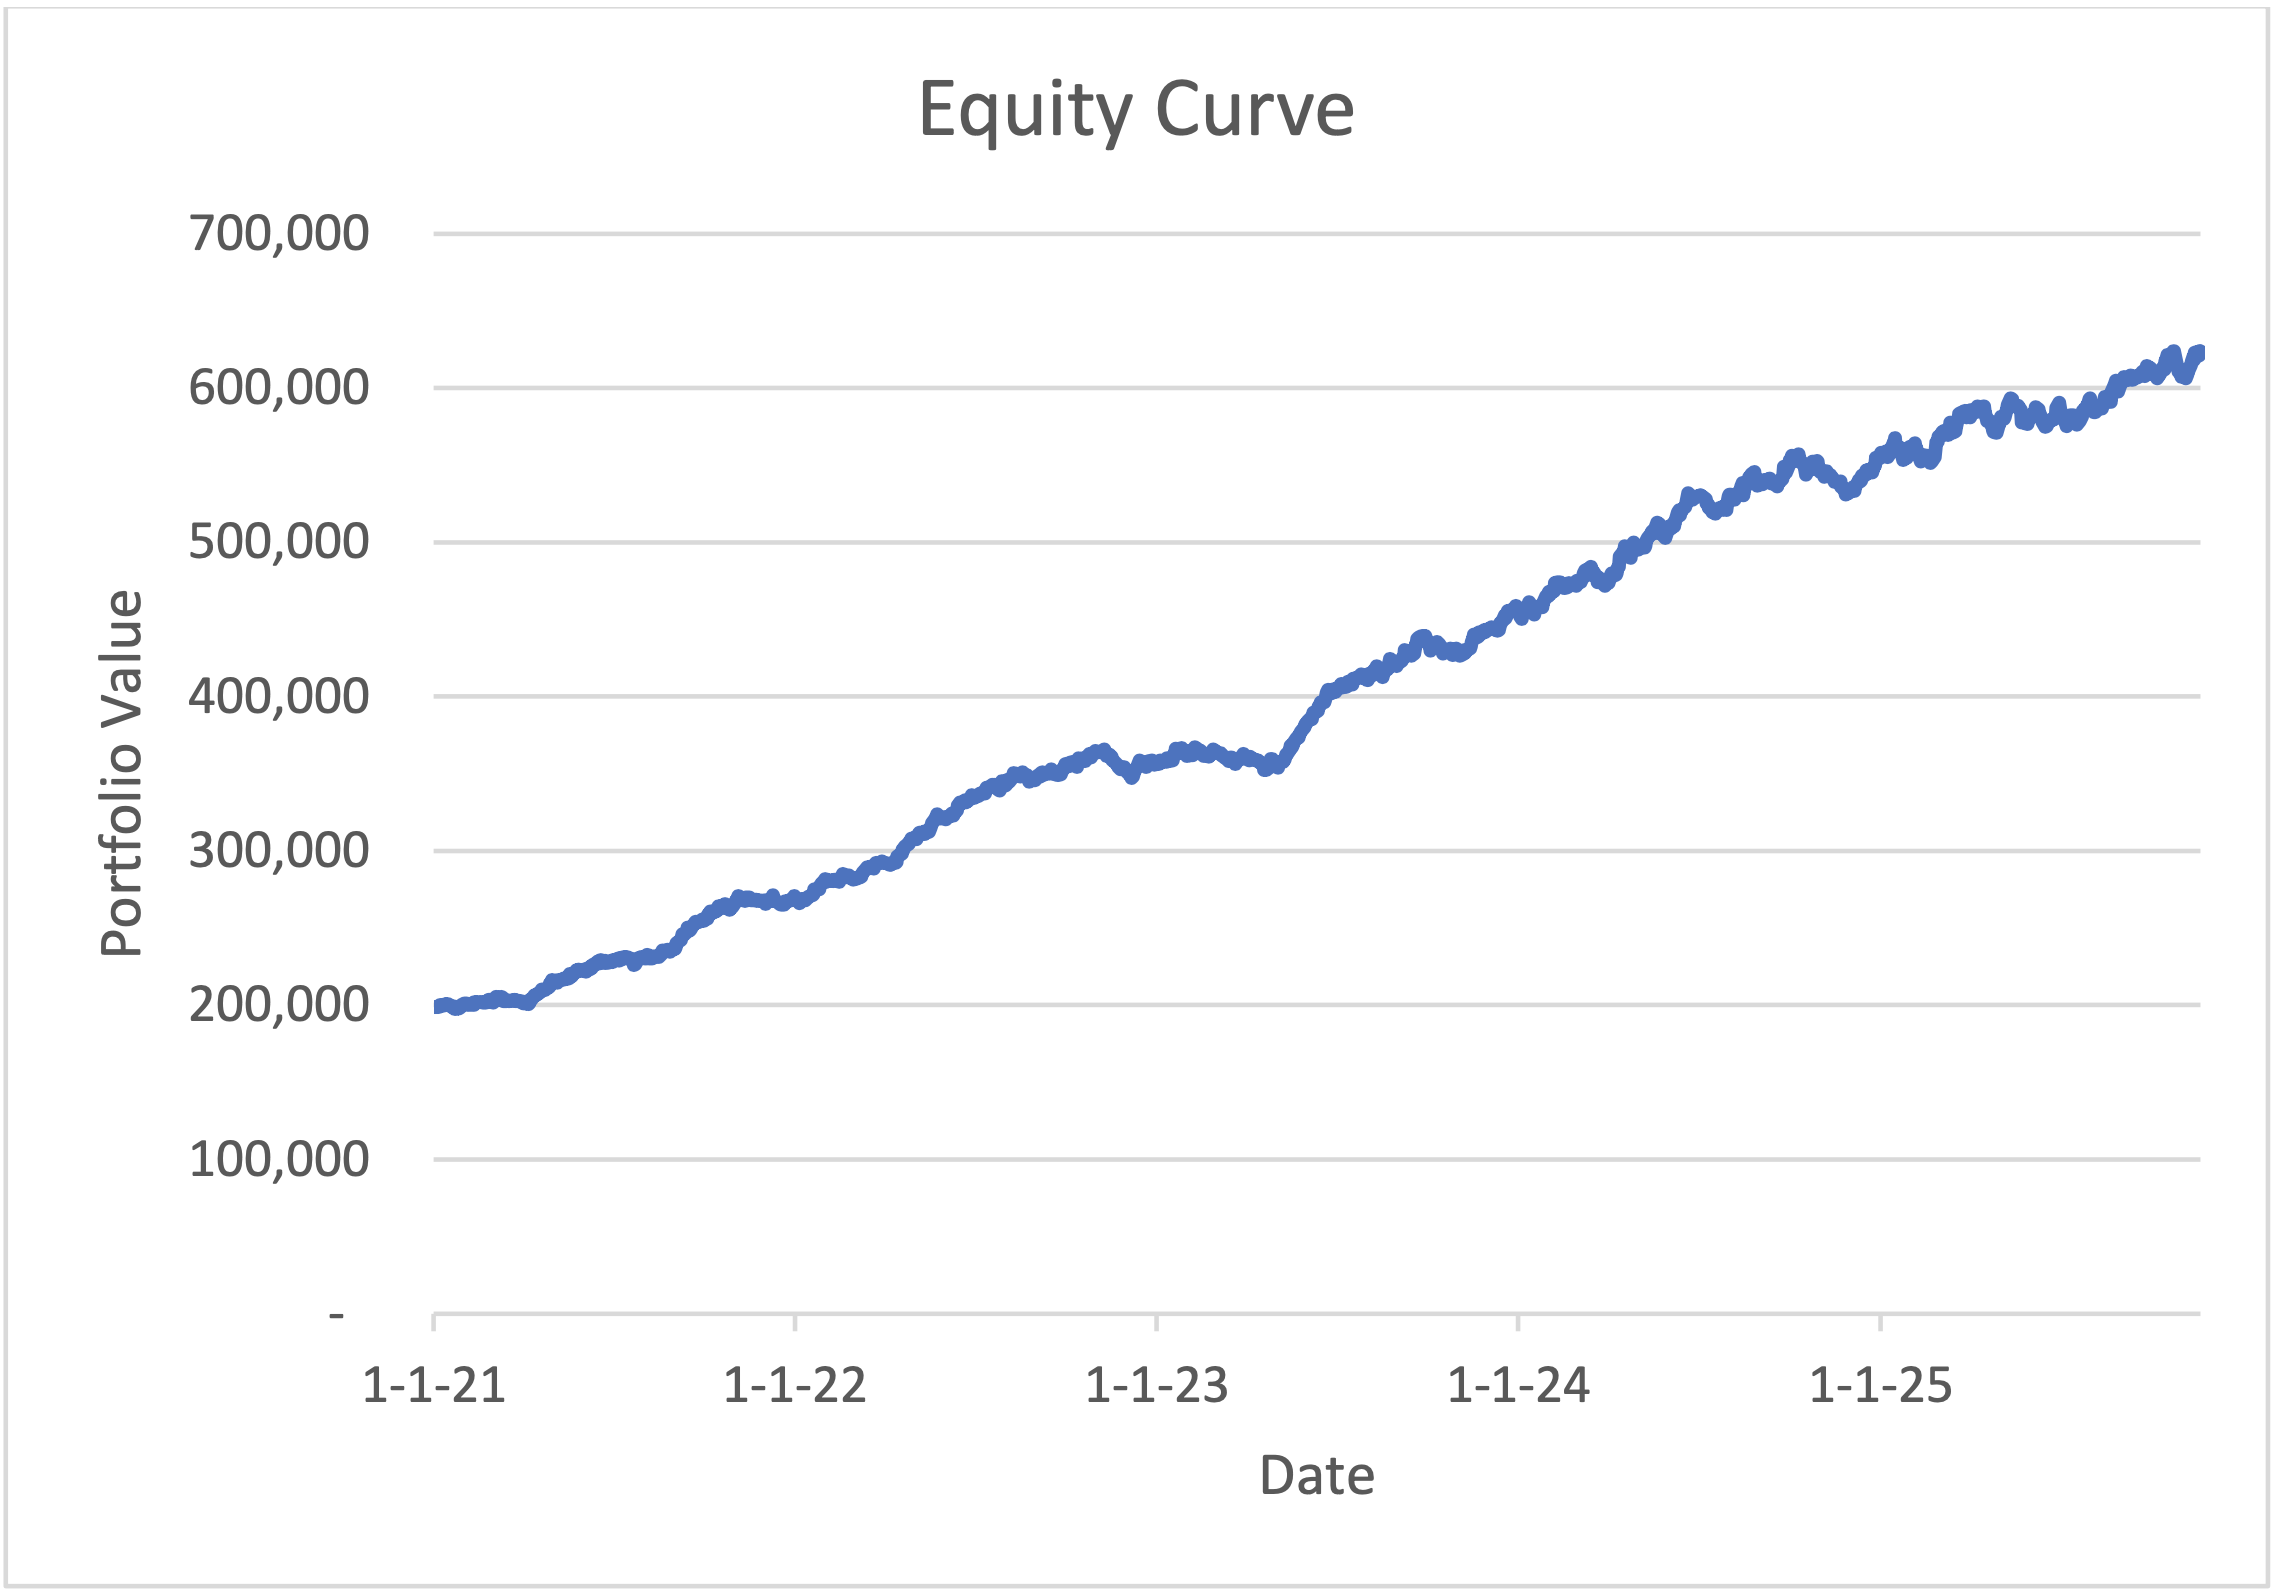
This is what 0.1% per day on average (after wins and losses and costs) looks like over time (forecasted).

The equities basket trading results above is from one of our subscribers, chipping away at things day after day. His results are above the benchmark which might be sustainable, or he may experience mean reversion. Note: all strategies have some form of outperformance and underperformance along the way.
Enjoy what we have democratized for you: the ability to use quantitative data to harvest the signals as well as the noise in the market. Profitable trading!
Rob
CEO, Director of Education
Start Trading with Odds
Get access to the Seasonality Almanac Dashboard, as well as 1 basic course, for free!
