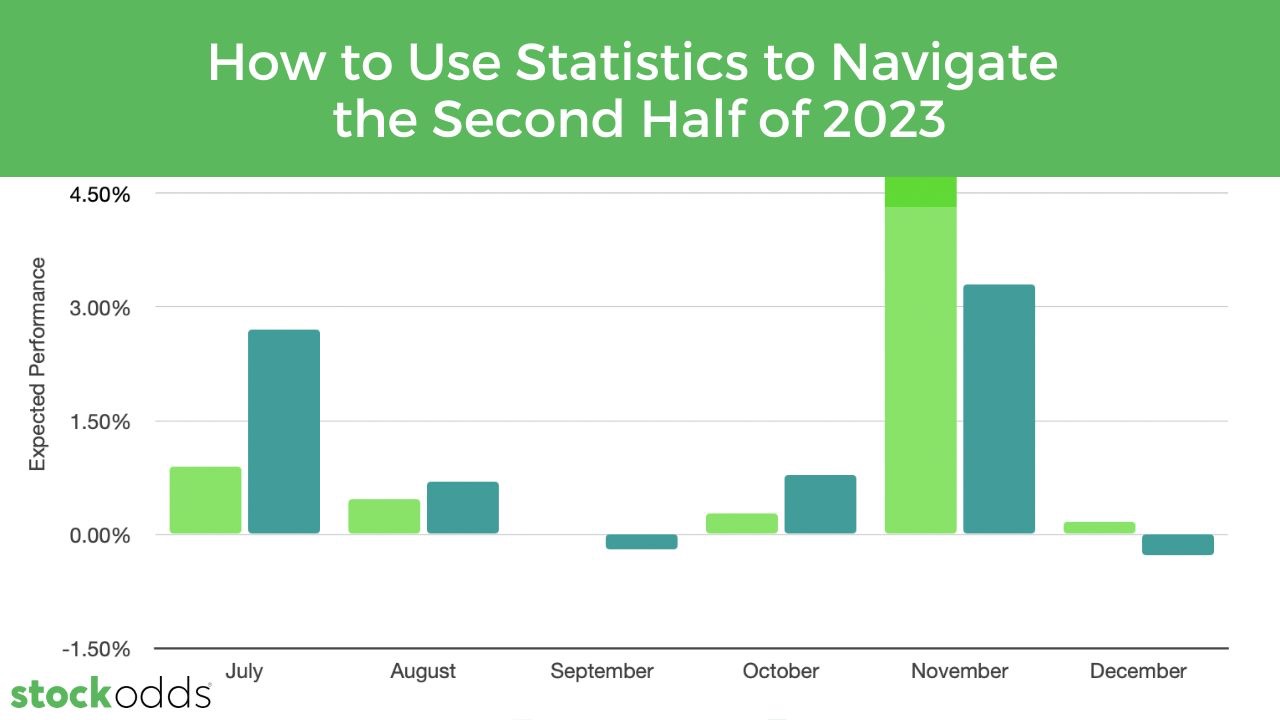
As we step into the second half of 2023, the financial landscape seems to be shrouded in a cloud of uncertainty, with many fund investors and fund managers admitting they don't know where to go from h...
Looking for stocks to trade and want to plan ahead of time? The StockOdds Seasonality Dashboard is a great resource for identifying potential bullish and bearish trade ideas in a given seasonality per...
UPDATE: the actual performance of this trading basket, on a capital-balanced basis, was +0.35% ROC for the day.
|
Symbol |
Action |
January 31 Close |
February 1 Close |
Return |
UPDATE: the actual performance of this trading basket, on a capital-balanced basis, was +0.56% ROC for the day.
|
Symbol |
Action |
December 30 Close |
January 3 Close |
Return |
UPDATE: the actual performance of this trading basket, on a capital-balanced basis, was -0.07% ROC for the day.
|
Symbol |
Action |
November 30 Close |
December 1 Close |
Return |
UPDATE: the actual performance of this trading basket, on a capital-balanced basis, was +1.92% ROC for the day.
|
Symbol |
Action |
October 31 Close |
November 1 Close |
Return |
UPDATE: the actual performance of this trading basket, on a capital-balanced basis, was -3.87% ROC for the day.
|
Symbol |
Action |
September 30 Close |
October 3 Close |
Return |
UPDATE: the actual performance of this trading basket, on a capital-balanced basis, was -0.41% ROC for the day.
|
Symbol |
Action |
August 31 Close |
September 1 Close |
Return |


