How to Use Statistics to Navigate the Second Half of 2023
Jul 21, 2023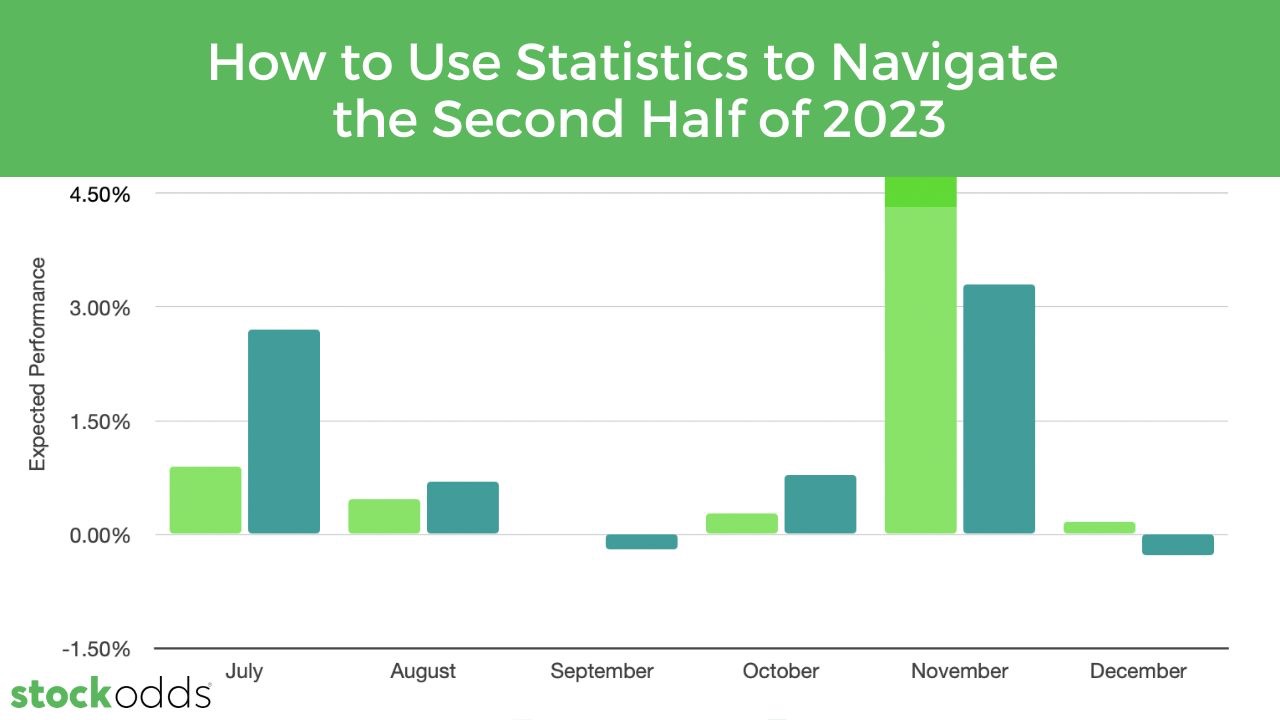
As we step into the second half of 2023, the financial landscape seems to be shrouded in a cloud of uncertainty, with many fund investors and fund managers admitting they don't know where to go from here. The market has shrugged off further rate hikes, inflation and recession concerns and climbed that wall of worry. AI has given the market some tailwinds but perhaps too much too fast. Wall Street forecasters are now scratching their heads as they peer into their cloudy crystal balls, wondering what the rest of the year has in store.
It's clear that for some, the traditional playbook for market predictions has been tossed out the window. However, this doesn't mean we are left entirely in the dark. By referring to past statistics and betting on relationships continuing to play out, we can still make educated predictions about the market's trajectory, most specifically with how certain symbols perform relative to one another.
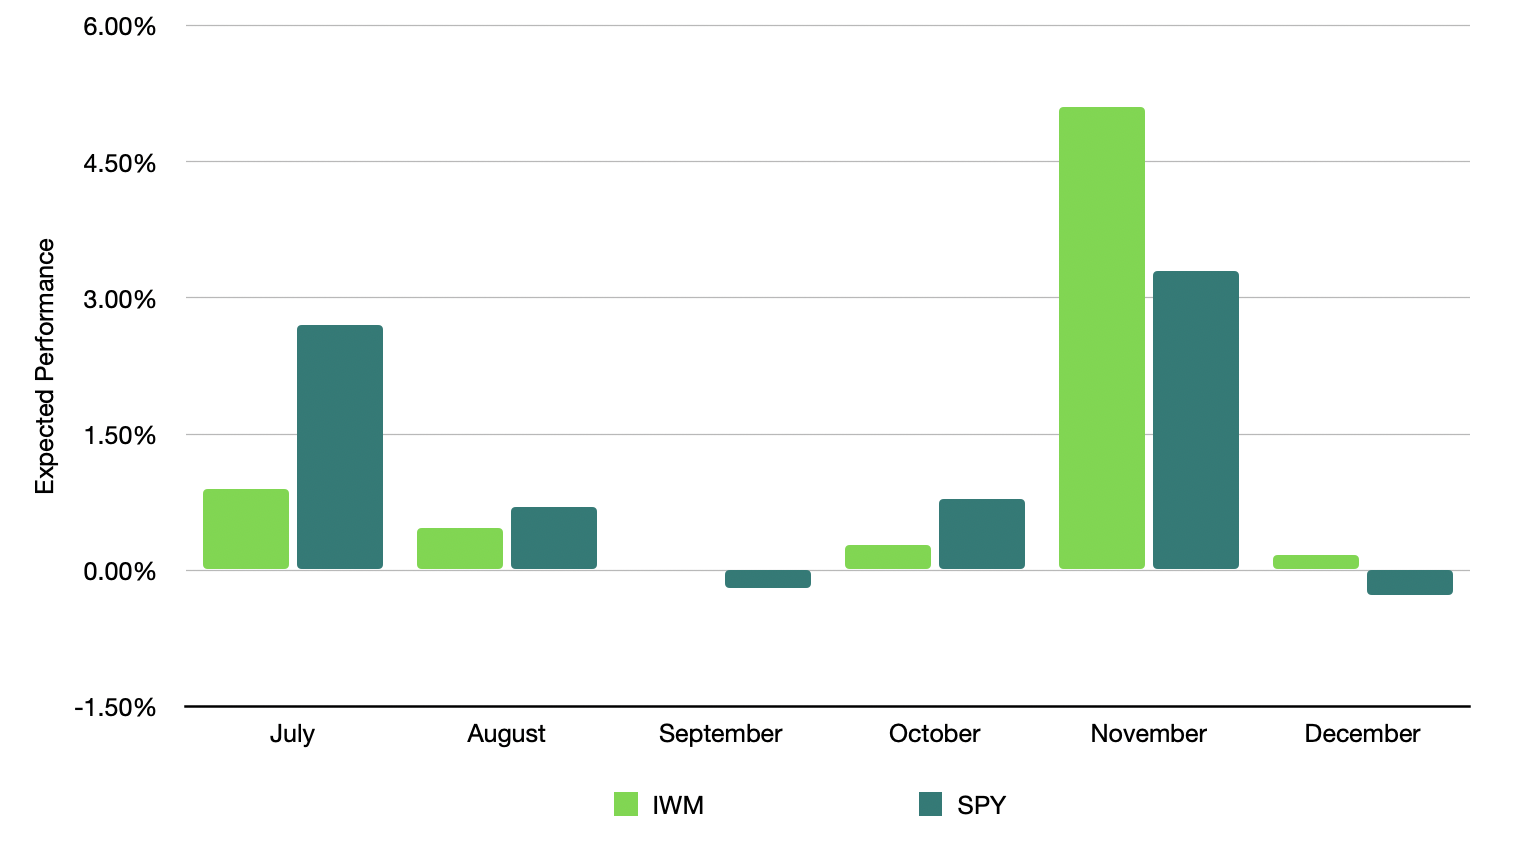
Let's look at the seasonality statistics between larger companies in the S&P 500 index (SPY) and small-cap companies in the Russell 2000 index (IWM) for the next six months, based on average performance over the last eight years:
|
Month |
IWM |
SPY |
|
July |
+0.90% |
+2.70% |
|
August |
+0.47% |
+0.70% |
|
September |
-0.002% |
-0.19% |
|
October |
+0.28% |
+0.79% |
|
November |
+5.10% |
+3.30% |
|
December |
+0.17% |
-0.27% |
These statistics suggest that, on average, both the S&P 500 and the Russell 2000 tend to perform positively for most months in the second half of the year. This trend indicates a potential opportunity for investors to capitalize on the historically strong performance of these indices during this period.
However, it's important to remember that these are averages and not guarantees. The market is influenced by a multitude of factors, and past performance is not always indicative of future results. The current economic climate, characterized by rising interest rates and stubbornly high inflation, adds an extra layer of complexity to the mix. What may be more reliable, is to count on the relative performance of SPY vs. IWM (or other symbols). For example, one could take a long position in IWM and short position in SPY for the month of November, capitalizing on IWM outperforming SPY.
In conclusion, while the second half of 2023 may be shrouded in uncertainty and market participants tend to be forward looking discounting what is known. These days it can be especially challenging to sift the macro considerations, corporate earnings projections, disruption from tech and especially from AI. This is why leaning on historical data and ongoing market trends can provide some guidance. Investors should remain vigilant, stay informed, and be prepared to adapt their strategies as the market evolves. As always, diversification and a statistics-backed perspective remain key to navigating these turbulent times.
The above statistics were gathered using the StockOdds Seasonality Almanac, which is available for free after signing up here.
Start Trading with Odds
Get access to the Seasonality Almanac Dashboard, as well as 1 basic course, for free!
