Do you know one of the best momentum indicators for short-term trades?
Apr 29, 2022
Connors-RSI (or just Connors for short) is one of the perfect momentum indicators for the short-term trader, whether you are trading at home or working in a professional capacity. You might be thinking, “I already have RSIs to identify overbought or oversold trends,” but really, traditional RSIs are good within a longer timeframe. If you want to up the Odds on executing excellent trades in the short term, Connors-RSI is a must-have addition to your trading repertoire. Luckily, we have data on that.
The Three Components
Three main parts go into the Connors-RSI formula — which was developed by Larry Connors — are Relative Strength Index (RSI), the Up/Down Streak Length, and the Magnitude of Price Change.
RSI
RSI measures the speed and amount of change in a stock price. The indicator moves between 0-100. Generally, traders and investors will choose a period to measure the change. However, it does need enough time to rule out false indicators, which is why Connors Research, the company behind Connors-RSI, created their own indicator — traditional 14-period RSIs just couldn’t move fast enough.
For those that like traditional RSI’s, StockOdds has an RSI-2 Dashboard with 3-day returns, and the Web Screener/API has RSI-2 as well as RSI-14 with a variety of subsequent output timeframes like Open to Close, 3-days, Weekly and Monthly.
Up/Down Streak Length
Up/Down Streak Lengths measure how long a trend has lasted. In other words, it measures how many days in a row a chosen security is moving along its uptrend or downtrend.
For example, the security has closed at a higher price than the previous day’s price for three days in a row. The Up/Down Streak Length would be a +3. If it closed lower for three days in a row, the score would be -3. With no change, it resets to 0.
In Connors-RSI, a 2-RSI period is applied to the Up/Down Streak Length value, but we’ll get to that below.
Magnitude of Price Change
The final component in the Connors-RSI (CRSI) formula is the magnitude of price change. This compares the most recent price change of a security to the changes that are lower than the most recent one in a set number of periods.
For example: If the trader decides on a 30-day timeframe, and 18 of those periods are lower than the price change that just occurred, the magnitude is 18/30 = 0.6 or 60%.
Like an RSI, the magnitude functions between 0-100 (because it is a percentage). The closer it is to 100, the larger and more positive the day’s change was.
The Formula
Once all three components have been found, traders can simply pop them into the formula for Connors-RSI (or, if they’re lucky, monitor it in the StockOdds Web Screener). Here’s what it looks like:
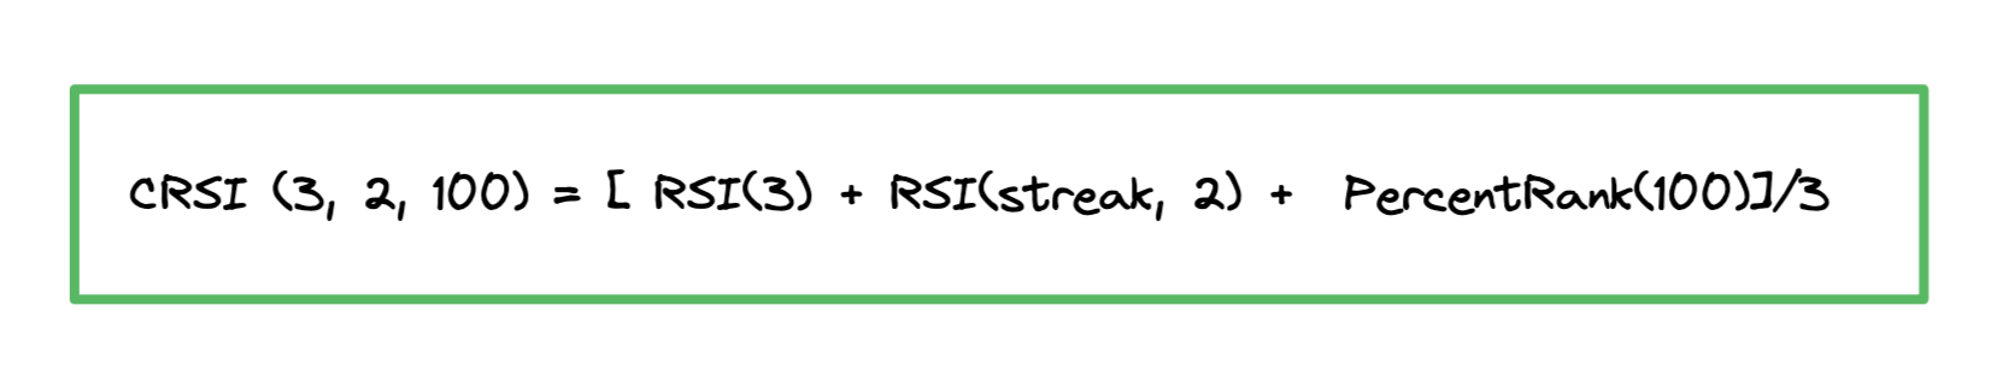
This formula produces an average of the three components and will equate to a number between 0-100. The easiest parameters to start with are the 3, 2, 100 indicated in the formula. However, traders with a specific goal in mind can adjust them as needed. The StockOdds Web Screener makes it easy: just choose either the Connors 3, 2, 100 or the 14, 2, 100 and let it do the heavy lifting for you as an indicator.
When to Buy/Sell
Due to Connors-RSI functioning within such a tight timeframe, traders typically look for more extreme numbers within that 0-100 range before pulling the trigger on a trade. Traditional RSIs look for a 30-to-70 range, where 30 indicates oversold and 70 indicates overbought. With Connors, the range should be less than 20 and greater than 80 and even as extreme as 5 and 95. Those numbers should help mitigate any false indicators that crop up due to the volatility and speed under which the formula functions.
Where the real advantage comes in, is knowing what happens after a given Connors value. With the StockOdds Web Screener, subscribers can look up the odds and statistics on thousands of symbols, including the Connors value. For example, Connors (3, 2, 100) for a given symbol could show as 5, which would indicate that stock is oversold, but the Odds and average performance for the days following could still be bearish. This is the advantage of StockOdds Data, using statistics to gain insights into market behavior.
As Connors-RSI is an indicator, when it reaches the extreme ends of the range, it should prompt you to dig into news, view the symbol through the lens of other indicators, and check the Odds and Average Performances expectations for your subsequent timeframe, to add additional validity. Dropping below an oversold threshold could mean a buy opportunity and rising above the overbought could mean the security will experience a pullback, but all is probabilistic in nature, so feel free to investigate further.
These are the basics of a Connors-RSI, which, again, is a great tool for traders who want to function in shorter timeframes with an indicator that has built in look-back periods. Whether you are a professional trader or new to this career, you may be looking to improve your skills, and StockOdds can serve your needs for statistical data as well as educational courses. Combined, these can increase your Odds. Please check out our other blog posts for the basics on various tools and indicators.
Start Trading with Odds
Get access to the Seasonality Almanac Dashboard, as well as 1 basic course, for free!
