Hot Stocks for August 2 - SHOP, ETSY, WYNN, CAT Seasonality
Jul 27, 2021
UPDATE Aug 2: the actual performance of this trading basket, on a capital-balanced basis, was +1.56% ROC.
|
Symbol |
Action |
July 30 Close |
Aug 2 Close |
Return |
|
SHOP |
Long |
US$1499.93 |
US$1538.67 |
2.58% |
|
ETSY |
Long |
US$183.51 |
US$188.89 |
2.93% |
|
WYNN |
Short |
US$98.33 |
US$98.37 |
-0.04% |
|
CAT |
Short |
US$206.75 |
US$205.16 |
0.77% |
|
Total |
|
|
|
1.56% |
When looking for hot stocks to trade, or ones more likely to move in a given time period, StockOdds Powered Dashboards provide quick and easy insights for stocks and ETFs. The free Seasonality Almanac provides Odds and performance data, based upon seasonality conditions, such as the First and Last Trading Day of the Month, 3rd Friday and others.
Seasonality for The First Trading Day of August
Using the Seasonality Almanac, we can generate ideas for stocks to trade in August. In this case, we’ll take a look at the First Trading Day of August, which for 2021 is August 2. On the first page of the dashboard, we can easily pick out the bottom and top performing stocks by taking into account both the average % change and Odds numbers. In this case, we’ll take a look at Shopify, Etsy, Wynn Resorts and Caterpillar.
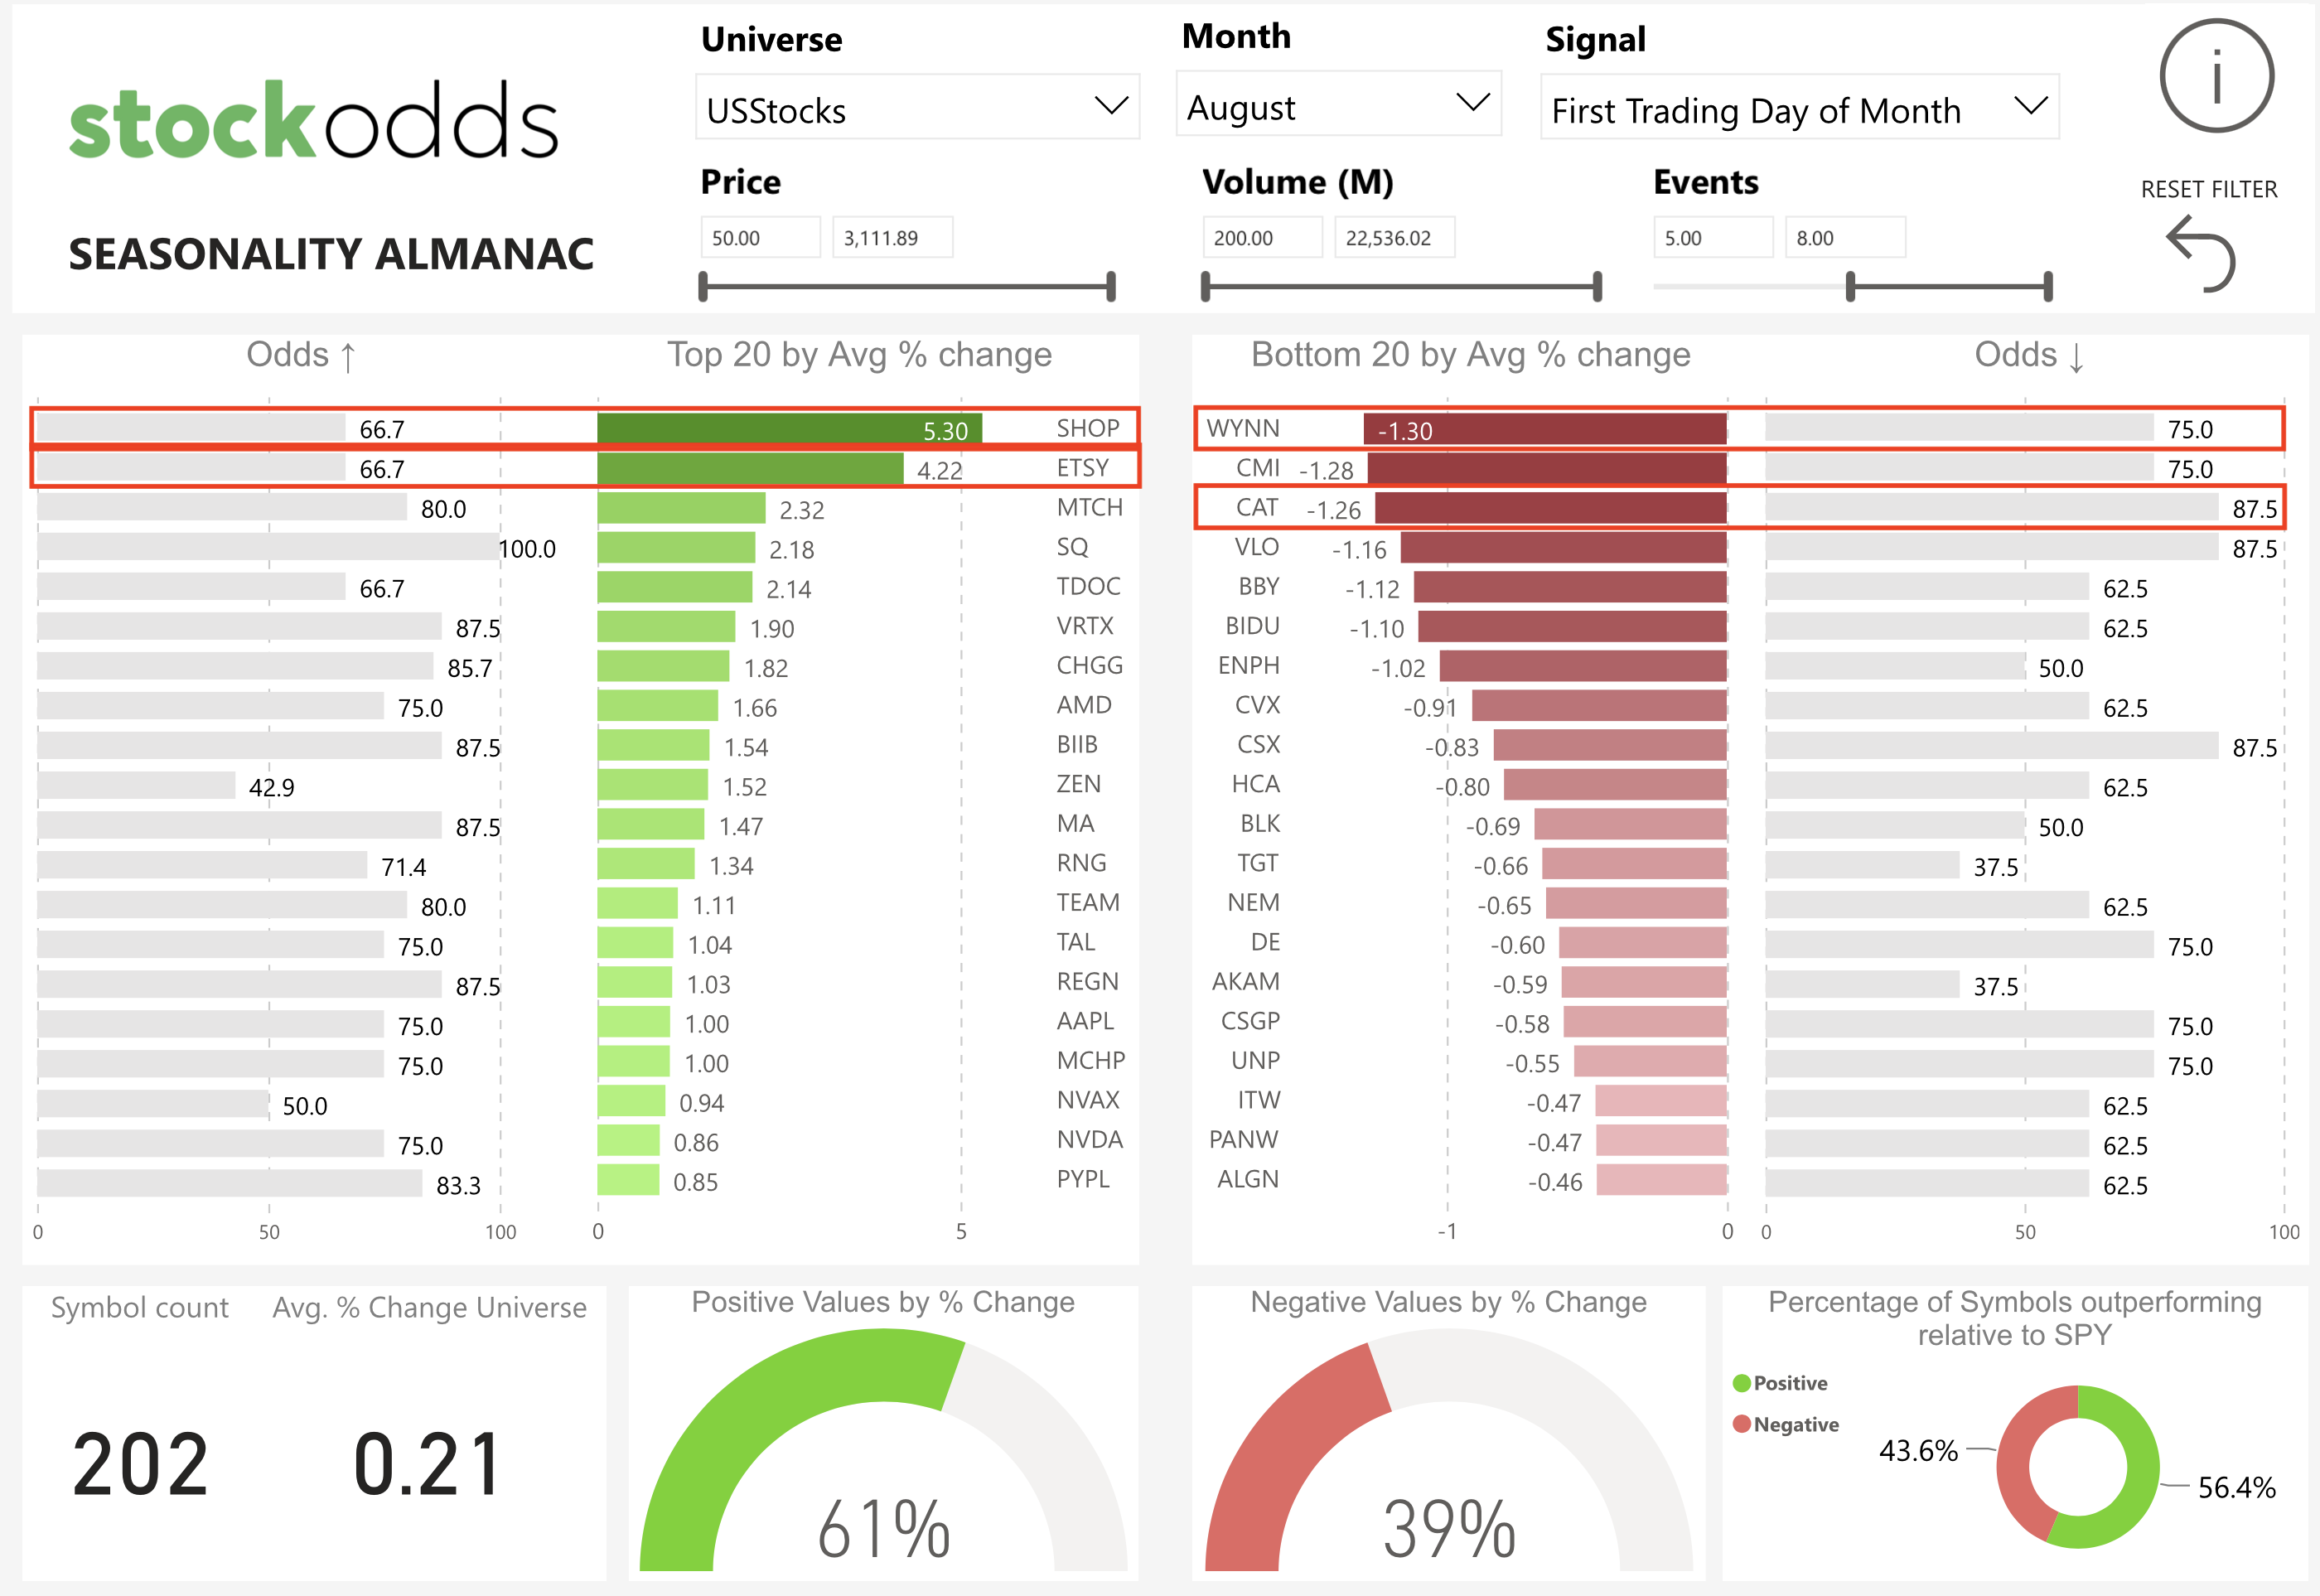
From this, we can see on the first trading day of August, SHOP and ETSY historically have 66.7% Odds of going up, on average by 5.30% and 4.22%, respectively. On the short side, WYNN has 75% Odds of going down, on average by -1.30%. This compares to CAT, which historically has more instances of performing poorly on the first trading day of August, with an average movement of -1.26%.
Given the performance stats of SHOP, ETSY and WYNN, they could’ve been affected by outlying performance from a pandemic drop/rise in 2020. It’s important to check whether these symbols had significant performance in the past first trading day of August.
For context, these numbers are drawn from the last 10 years of available data, or all available data in the case a stock IPO’d less than 10 years ago. Data from 10+ years isn’t included, as market behaviour changes over time; patterns and conditions today are different than in the 80’s and 90’s.
Before taking these statistics for granted, it is important to look for factors which may have contributed to past performance. In the case of SHOP and CAT, Q2 earnings are usually released at the end of July. For ETSY and WYNN, earnings are typically released around the beginning of August. For all these stocks, there could be cases of “Buying the hype, selling the news,” which also contribute to their Odds and performance on the first trading day of August.
This year, SHOP is releasing earnings the morning of July 28, CAT the morning of July 30, ETSY the evening of August 4, and WYNN sometime on August 3. Knowing this, one has to take into account the effect CAT earnings will have on the closing price of July 30 this year.
SHOP Seasonality for August
Navigating to the second page of the Seasonality Almanac, we can take a closer look at Shopify’s performance for the entire month of August, alongside SPY for context.
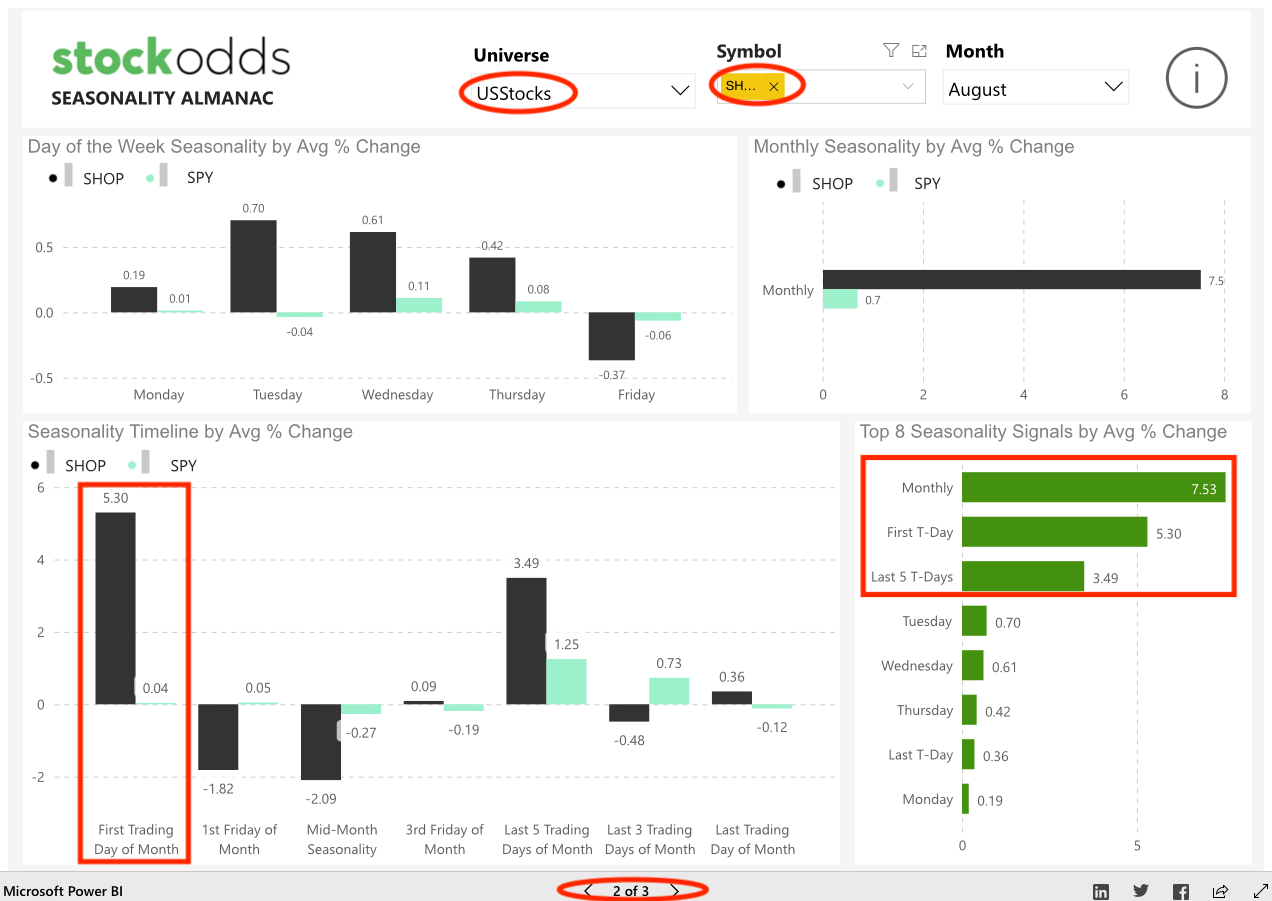
Taking a look at the bottom-left, we can see the historical performance of SPY has remained fairly flat, compared to SHOP, which fair outperforms the index. Also looking in the right-hand section, we can see the top seasonality signals for SHOP. Though the monthly performance of SHOP has averaged 7.53%, we can see most of this performance likely comes from the first trading day of August, as well as the last 5 trading days of August. This can help frame intraday or swing trades for Shopify for the month of August.
A Deeper Dive into Industry ETFs for SHOP, ETSY
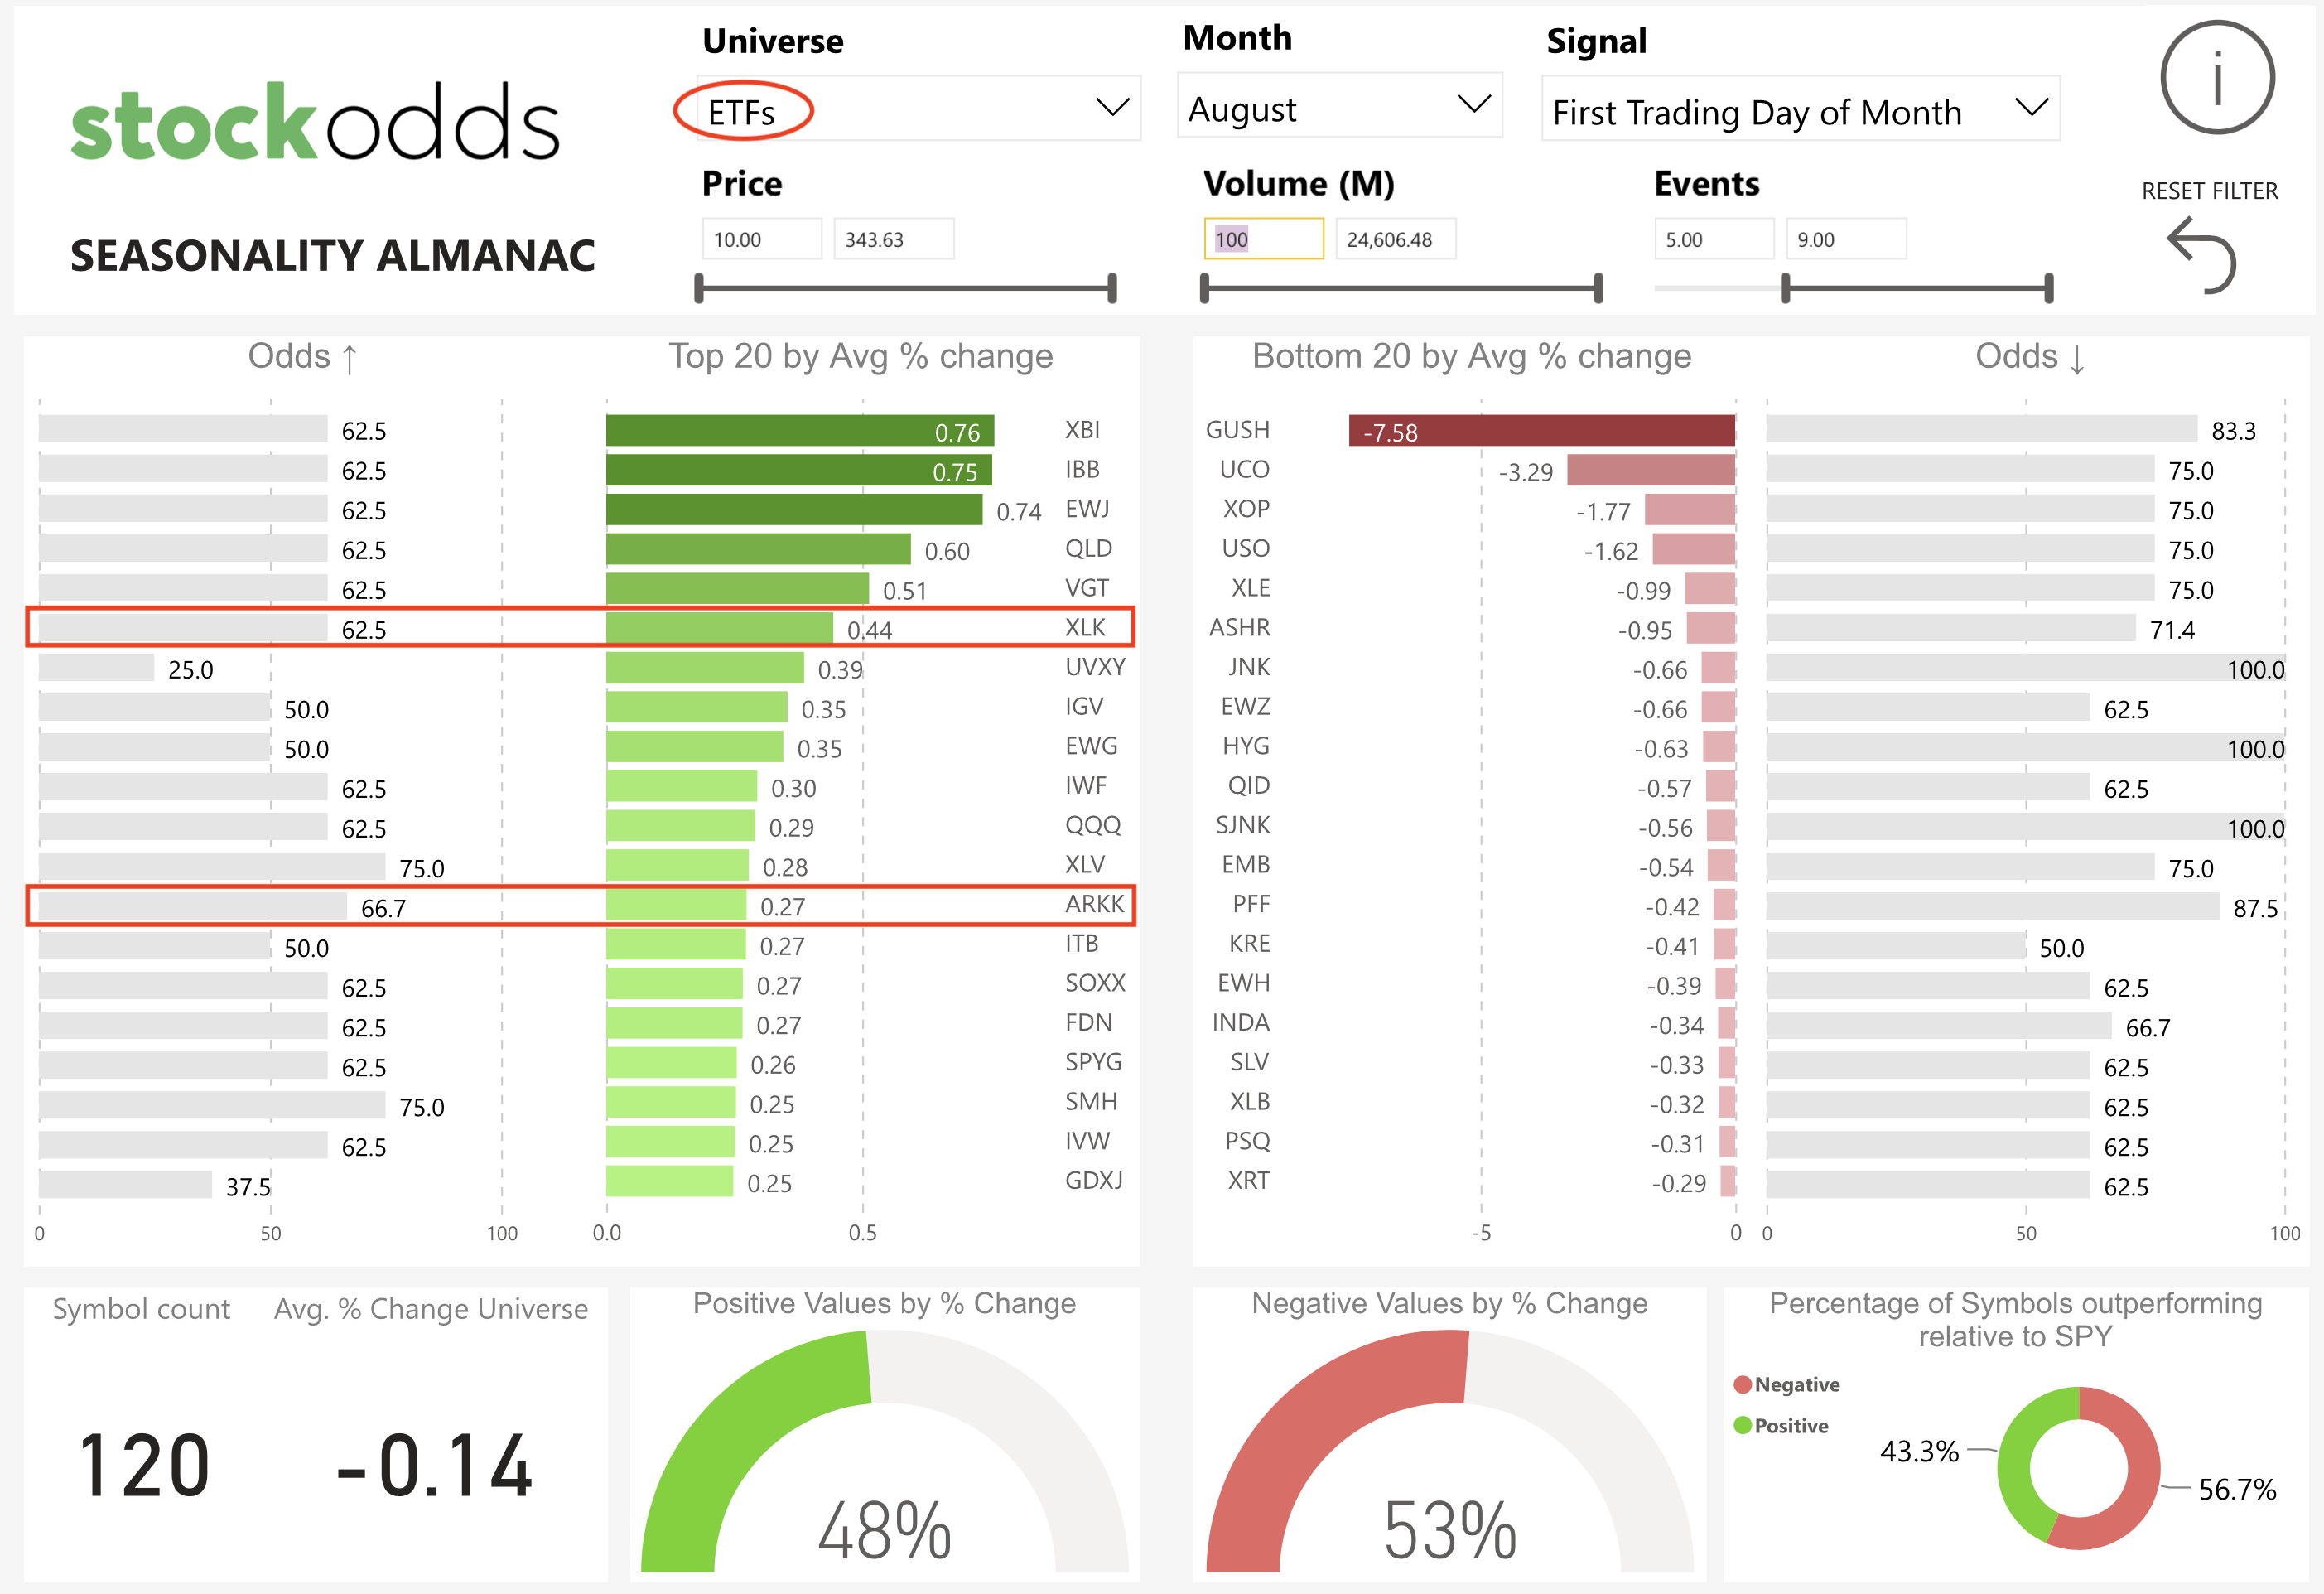
Switching to the ETFs view, we can take a look at some more broad trends for the first trading day of August. Both the average performance and the Odds are positive for biotech ETFs like XBI and IBB, as well as technology and innovation-related funds like XLK and ARKK. We can then compare this to oil and energy ETFs such as the 2x leveraged GUSH, UCO as well as XOP, USO and XLE, each of which have a negative performance expectation for the first trading day of August. As related industries and sectors tend to trade together, it is generally a good indicator to see positive historical performance and Odds for sector ETFs of which SHOP and ETSY are related to.
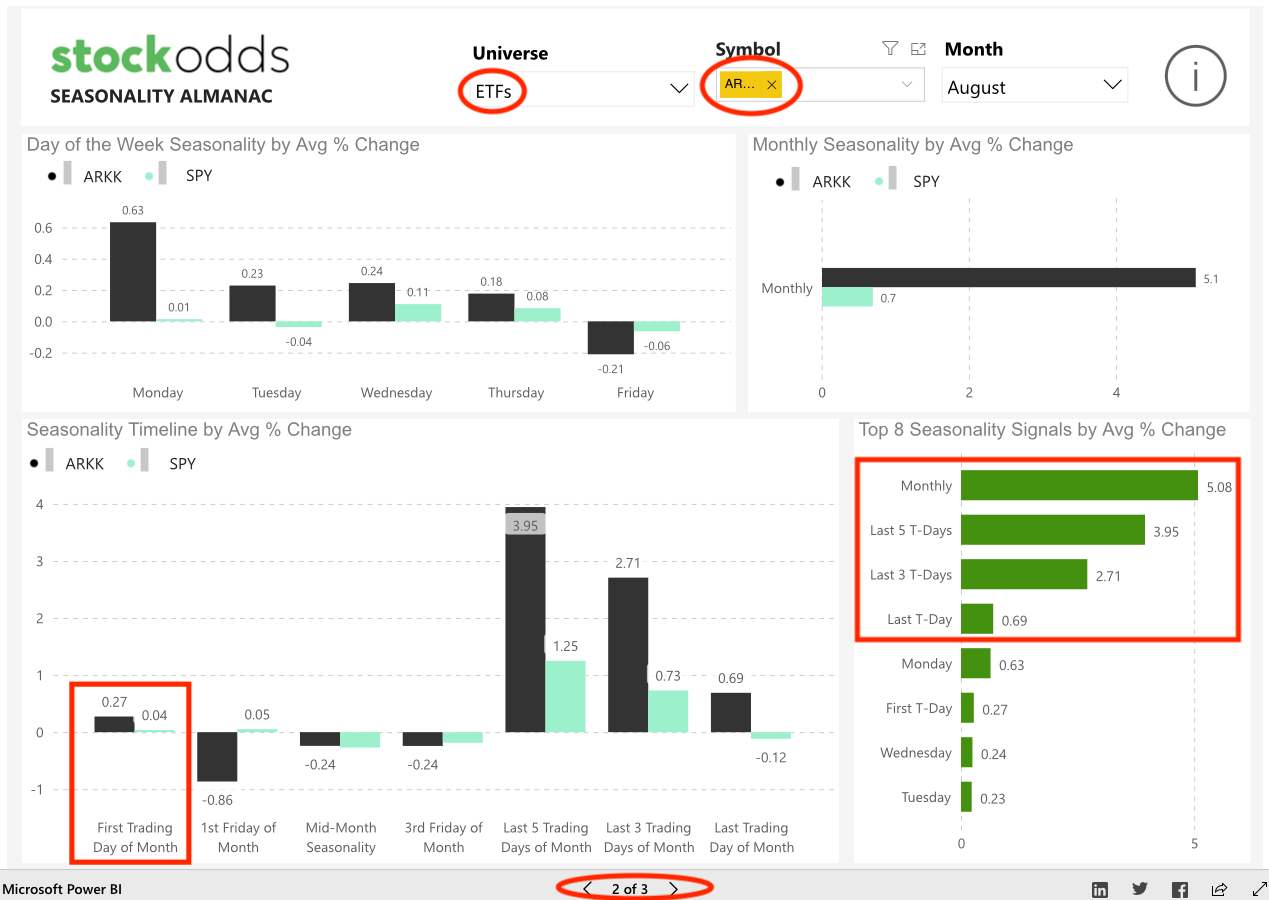
On closer inspection of seasonality patterns for ARKK, which Shopify is a component of, there has been strong average performance in the past (+5.08%) over the month of August. Compared to SHOP’s seasonality for the first trading day of August, ARKK’s past performance is significantly lower (+5.3% to 0.3%). Taking a look on the right side of the dashboard, we can see most of August’s performance for ARKK usually takes place in the last 3-5 trading days of August. As a note, SHOP is a higher priced stock, which may not be suitable for all traders and which may have larger bid/ask spreads. Putting all this information into action, one could hedge a SHOP trade for August 2 using ARKK.
Closing Thoughts
The Seasonality Almanac Dashboard uses close-to-close (CC) performance, so one looking to take these trades would enter positions on the last trading day of July and exit at the close of the first trading day of August. Why trade probability-blind, when you can trade with the Odds!
By taking a quick look at the summary numbers at the bottom of the dashboard (Positive & Negative Values by % Change, Percentage of Symbols outperforming relative to SPY), we can see that most ETFs meeting our filter criteria underperform the S&P 500 ETF. However, by taking a look at the individual symbols in our filters, most symbols are positive and outperform the SPY. This can help set the context for August 2, 2021, showing us a bullish bias for individual stocks.
Seasonality signals and performance extends beyond just numbers. There are fundamental reasons for why seasonality patterns exist, beyond quarterly earnings announcements. To find out more about these fundamental forces behind seasonality, our Seasonality Dashboard course is now available. In this course, we’ll also cover how to better utilize the Seasonality Almanac Dashboard, the basics of market dynamics, how to use a probability-based approach for trading and much more.
Start Trading with Odds
Get access to the Seasonality Almanac Dashboard, as well as 1 basic course, for free!
