How to Accurately Trade Using Stochastic Indicators
May 20, 2022
Whether you’re new to trading or a seasoned investor, if you want an easy-to-use, yet reputationally solid indicator, Stochastic Indicators (aka. Stochastic oscillators, aka. STOCH) might be the tool for you. They come with several useful strategies, pair well with our StockOdds Web Screener, and have long been a favorite tool of successful traders. Plus, they can tell you many different things with a single chart if you know what you’re looking for. Here’s how:
The basics
Originally developed in the 1950s by a man named George Lane, a STOCH’s main job is to determine a difference in a security’s price over a defined period of time — usually 5,14, or 28. Stochastics attempts to reveal possible turning points by comparing the losing price to the range of prices previously. The principle behind it is that prices tend to close near the extremes of a range before turning points.
What StockOdds does, is archive all these data points over your choice of look-back period and then provides the actual Odds and Average Performance expected for the subsequent timeframe. You can choose your Stochastic input period and output period through the easy to use Web Screener.
Stochastics looks at the highest closing number for the period and compares it to the lowest closing number for the period and turns that number into a percentage called %K. This is the first line you’ll see when you use a stochastic indicator. The other line is called the %D, and it is a 3-period moving average of %K. You end up with a two-line graph that can be applied to any chart to follow the trend.
Take a peek at the formulas:
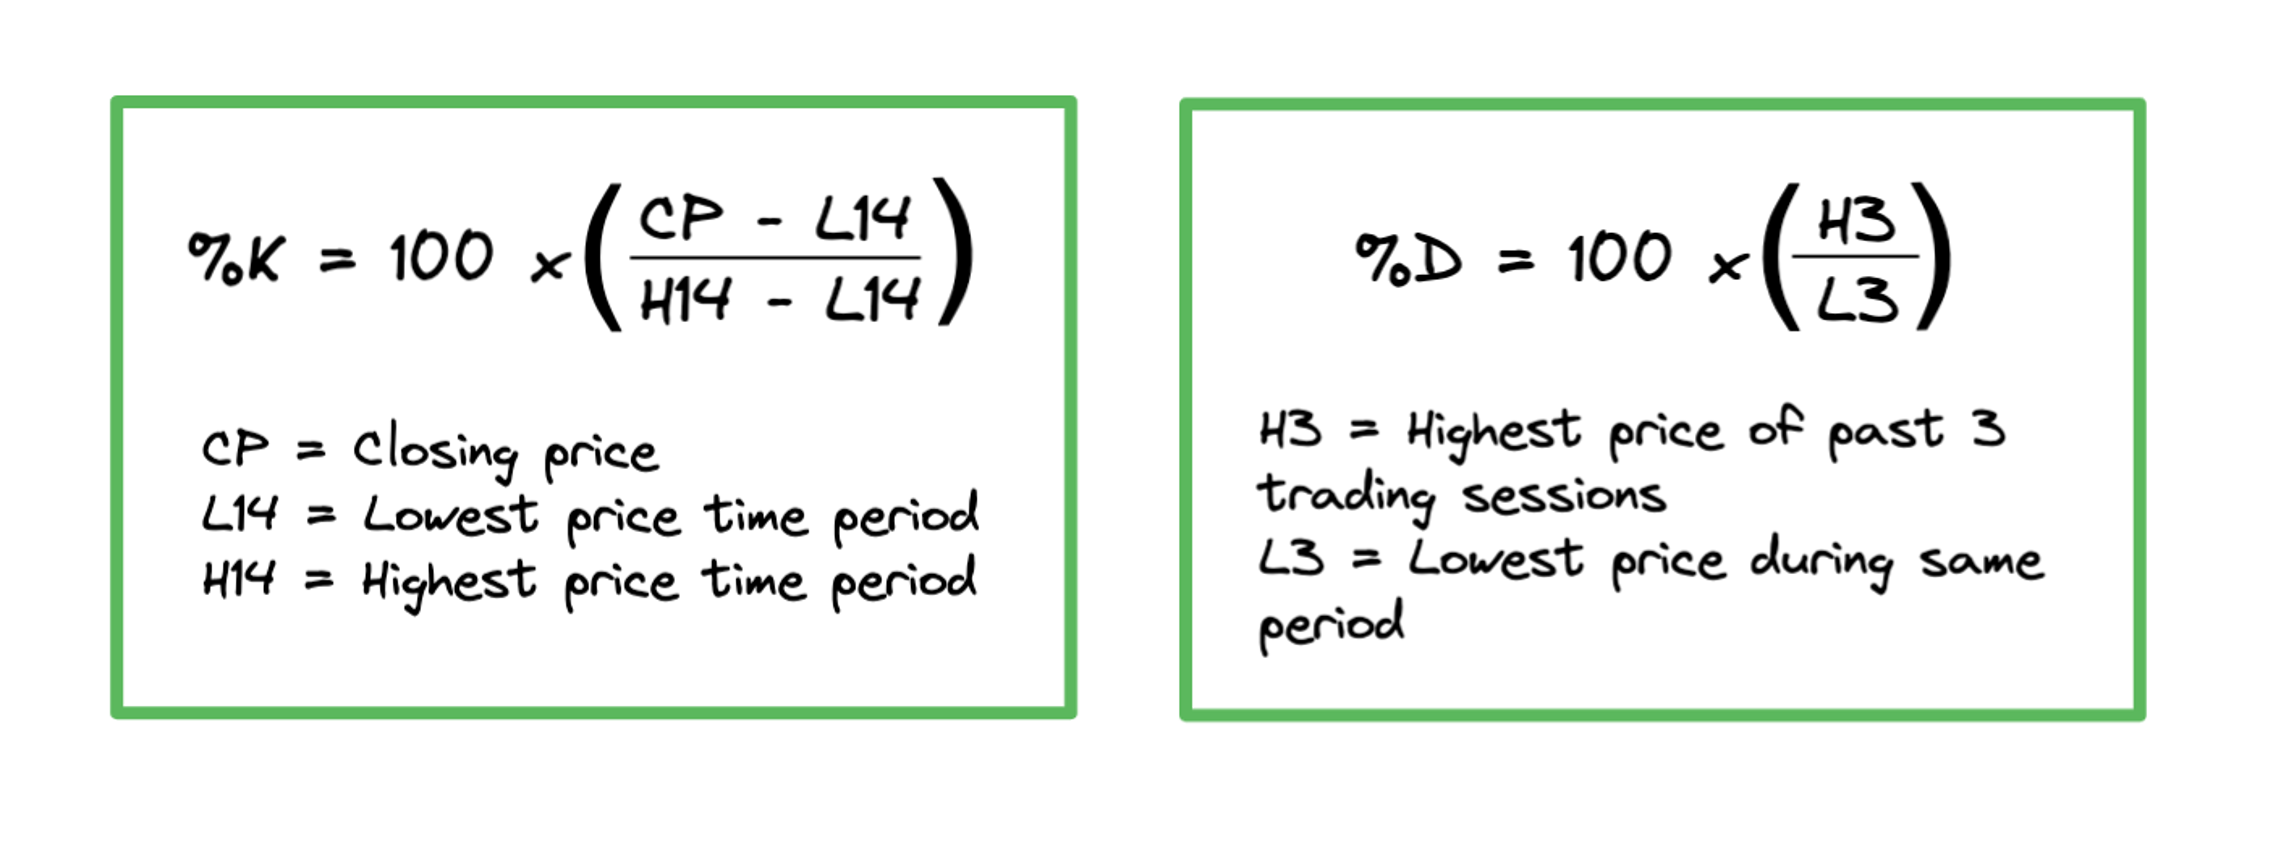
Given we’re calculating percentages, you can bet that where %K and %D fall within the 0-100 range will either indicate prices are high for your selected security or low. Those indicators are typically the 80% mark and the 20% mark.
How to use them
The quick version is that 80% indicates the stock is potentially overbought and generally recognized as a sell as the price closed high during the selected period. 20% is the opposite: the price closed low during the period, so the stock is potentially oversold. However, there are several ways to look at the lines and use them to increase your Odds while trading.
-
Overbought/Oversold
As mentioned, the first strategy for STOCH indicators is the overbought/oversold strategy. It’s straightforward but isn’t always the easiest entry and exit strategy for traders. When over 80, sell; when below 20, buy. However, the trends can last for a long time or experience a divergence, so this strategy should be used in conjunction with other data.
-
Divergence
Divergence is another strategy offered by stochastic indicators. Here, traders look at whether or not the STOCH is following the same trend as the actual security price. If it isn’t, it indicates a change in momentum and lets traders recognize where the trend may flip. If the stock price is high, but the STOCH is lower, the price may be ready to diverge.
A tip for this strategy: Don’t get overeager — Wait until the price actually begins to either go back down or up (depending on if it is a bullish or bearish divergence) before making the trade.
-
Bull/Bear
This strategy involves recognizing divergence indicators by using STOCH and then acting on a rebound in the price. So, if the indicator shows a bullish divergence (where the security shows a higher high than the indicator does), traders will wait for it to go down into the 50 range and start heading back up before selling.
-
Crossover
Finally, the crossover strategy is one of the most straightforward ways to use STOCH indicators. When the %K and %D lines intersect, traders receive either a buy or sell signal. If they cross up high (80 or above), there is a sell signal. If it is low (20 or below), then it is a buy signal.
Supercharging The Above Strategies with Odds
With any of the above mentioned strategies, traders are essentially guessing if the action following a certain STOCH value is going to be more bullish or bearish for each security they trade. With the StockOdds Web Screener, you traders don’t have to guess which way a stock usually moves after a given STOCH value. By adding Odds and the Average Performance of what historically happens after a given Stochastics value, traders can use statistics to their advantage. This can take some of the guesswork out of trading through adding mathematical probabilities to one’s trades.
For more information on different strategies traders can combine with StockOdds Data, check out this YouTube video.
As always, momentum indicators should be used alongside other strategies. While stochastic indicators are trusted as some of the more accurate and reliable, they aren’t infallible. Luckily, StockOdds has over 50 different signal conditions available on the Web Screener to ensure that your Odds are the best they can be for trading strategically.
Start Trading with Odds
Get access to the Seasonality Almanac Dashboard, as well as 1 basic course, for free!
