Navigating the Oil Shock with StockOdds: A Statistical Approach to Trading Opportunities
Apr 11, 2023
The world of investing is full of surprises, and one such surprise came when a coordinated supply cut announcement sent shockwaves through the markets. This situation presented an opportunity for traders & investors, but it also posed a challenge: how should one approach trading in the wake of an oil shock gap up? Do you have time in the morning to figure out all the fundamentals of the companies? Likely not. The StockOdds approach can help to provide a clear and effective strategy for navigating these uncertain waters.
The Oil Shock: A Market Opportunity
On Monday, April 3, WTI (West Texas Crude) futures experienced a significant increase, trading at $80.70, up 6.6% from the previous close of $75.70 on Friday, March 31. This spike in oil prices was likely due to a coordinated supply cut announcement over the weekend. As with any market or sector gap, this development presented an elevated opportunity for investors.
Preparing for Today's (April 3, 2023) Opportunity
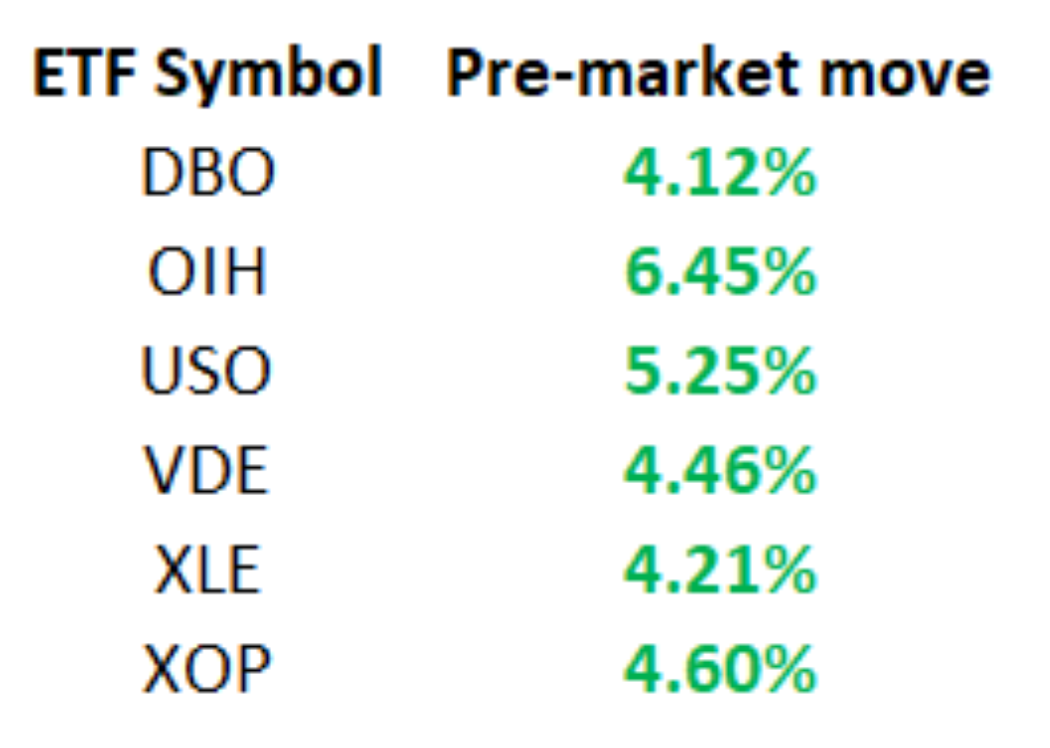
In the wake of the oil shock, traders may not have enough time to analyze all the fundamentals of the affected companies or determine the correlations of stocks to oil futures. Instead, they can focus on a statistical approach to make quick and effective trading decisions. Here are the Oil ETFs responding in morning to the overnight move in Oil Futures:
Thoughts on Background Context
Before the supply cut announcement, the price of oil was already trending upward, likely due to leaked information. Energy, as a sector, had been underperforming year-to-date because of various factors, including a focus on recession. Would Oil Stocks have been part of Month-end, Quarter-end window dressing by institutions? NO. Therefore, only insiders and their friends, along with those privy to leaked information, would have been front-running the news.
The STOCKODDS Web Screener to the Rescue
The STOCKODDS Web Screener is a valuable tool that provides a wealth of data which can be quickly exported to a CSV file, helping traders & investors make informed decisions in a short amount of time.

The following is a small Sample of the Data that is displayed that you can quickly export to CSV file:

The APPROACH
Most of the stocks are indicated to open 5% or more above Friday’s close. Do you want to be speculating and paying up 5% with all that risk? NO! Since it is impossible to predict whether stocks will gap and go further or gap and retrace back to fill the gap, traders and investors should aim for a hedged approach. Choices include shorting oil stocks and buying one of the ETFs or buying stocks and shorting one of the ETFs, which is riskier, as stocks have greater volatility than a statistically muted ETF (if they retrace you are going to get hurt). The better approach, however, is to go long on stocks with positive expectancy and short on stocks with negative expectancy, using Opening Only Orders. But what are the stocks to sell short and to buy long?
Sorting the OUTPUT for Today's Open to Close Trading
Sorting by average performance expectancy, day traders can choose from positive expectancy for long positions and negative expectancy for short positions. The Web Screener uses the signal of Friday's moves from open to close to derive expectancy for today's open to close action. To participate in the opening auction, use Market on Open order types and either equal capital per symbol or equal capital per basket.
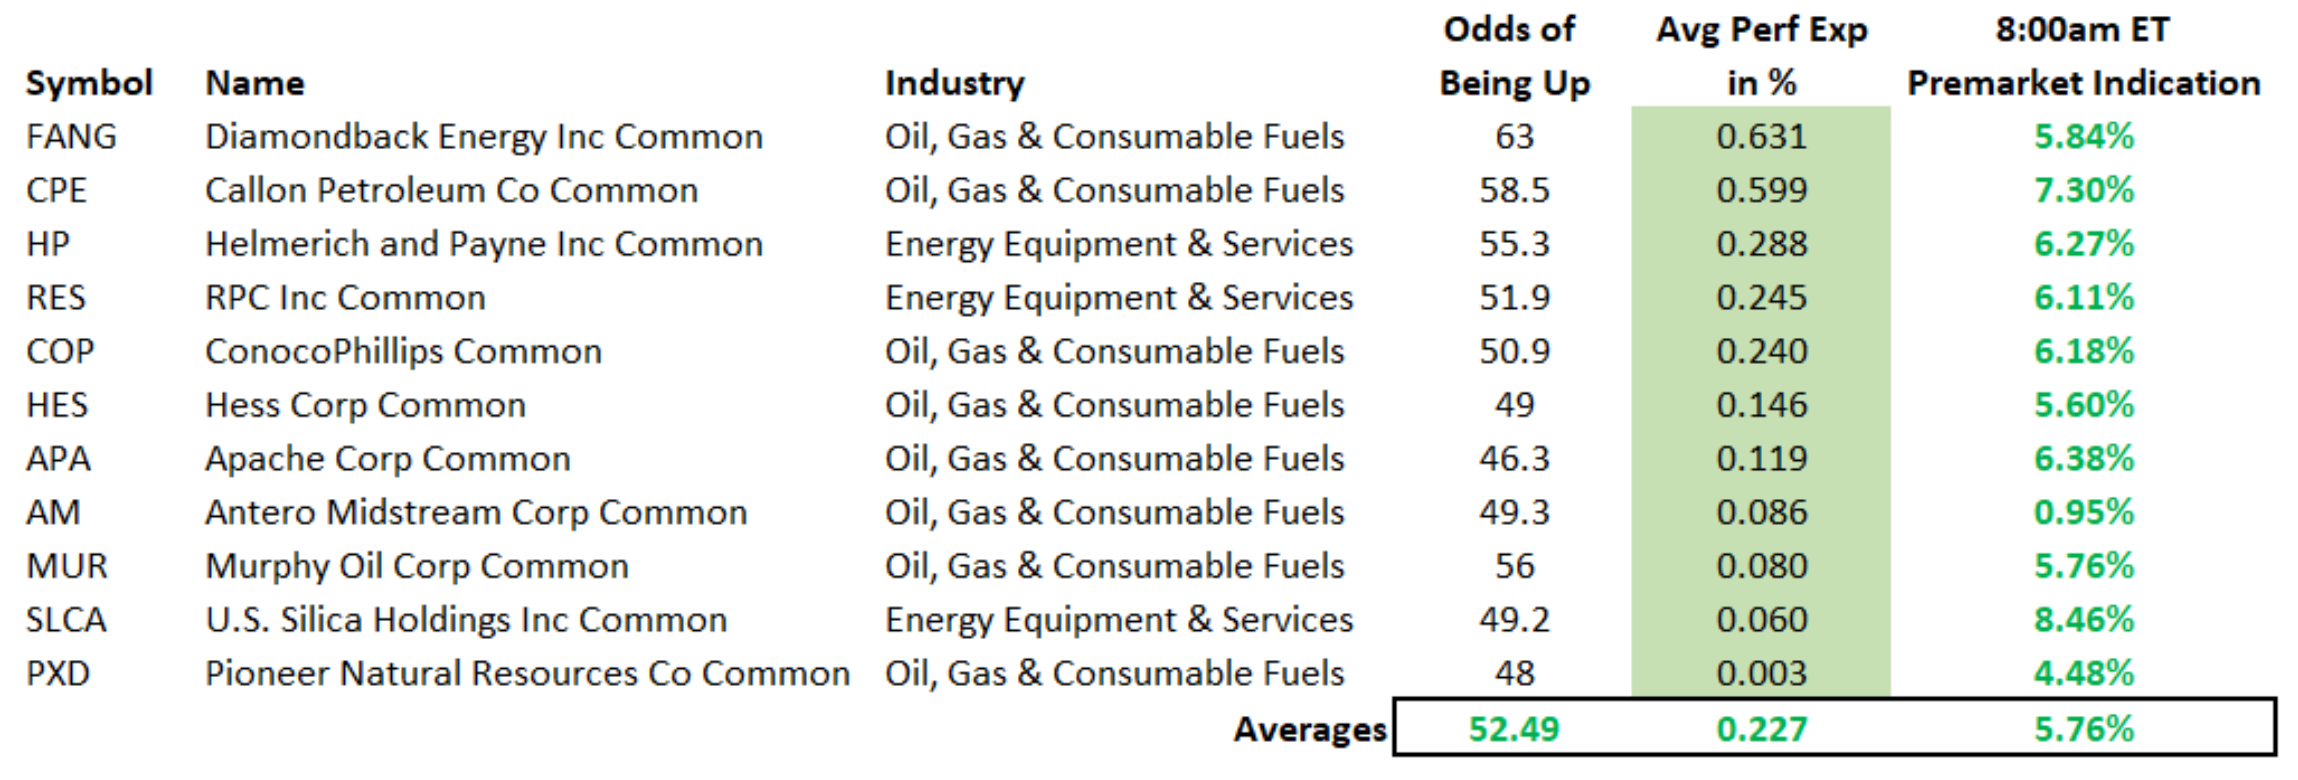
The LONG Candidates
Traders could buy these symbols at the open, but without adequate hedging, paying an average of 5.76% is a risky endeavor.
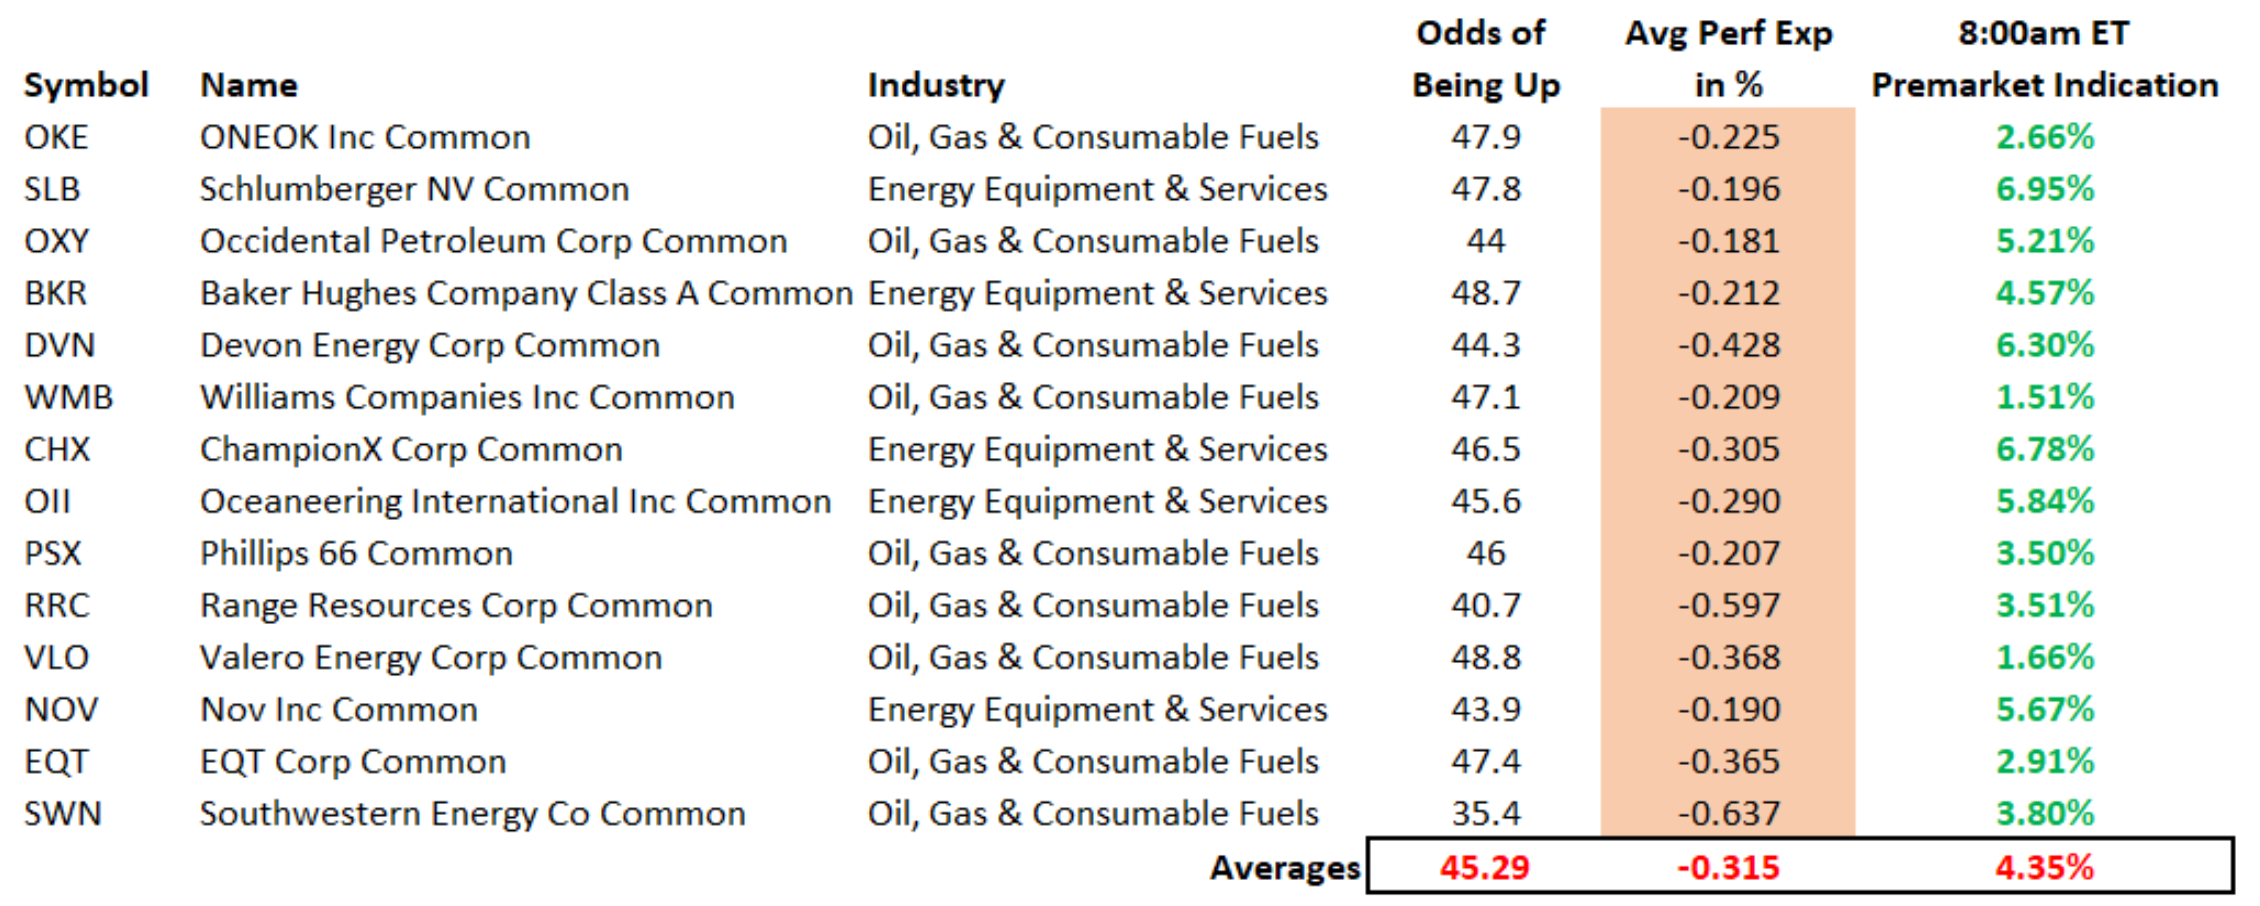
The SHORT Candidates
These symbols could be sold short at the open. The odds are low that they will be up after the open print. The average performance expectancy is negative, which is desired for short positions, and intraday traders can benefit from the stocks opening at a premium.
RESULTS from April 3, 2023 Open to Close
By applying $100,000 to the long positions (11 symbols) and $100,000 to the short positions (14 symbols), traders would have seen profits of +$1,670 USD from long positions and +$1,730 USD from short positions.

Summary
Statistical data can help investors decide which stocks to buy and which to short during a market gap, such as the oil shock. Embracing statistical data in times of uncertainty can provide better results than relying on human intuition. When you have to scramble to take advantage of a catalyst and the markets reaction to it, there is often no better way than embracing statistical data. Humans are confused...no one knows what will happen next. We can however rely on probabilities! In addition to the final outcome, the variance was very low intraday, and the hedging strategy provided peace of mind.
We hope this educational lesson content helps improve your trading!
Start Trading with Odds
Get access to the Seasonality Almanac Dashboard, as well as 1 basic course, for free!
