The Right Way to Frame a Trade: Calculating Expected Value
Aug 11, 2021
If you listen to the media reports, it can feel like the stock market is a force of nature separate from human intervention, with rises and crashes as capricious as the winds themselves. However, every investor, whether they are a 20-year veteran or a first-time trader, needs to remember that the stock market is solely made up of human and human-made interactions, and that while that there are mathematical equations that dictate the value of each investment, the value of each stock is only determined by the principles of supply and demand. The bottom line is that there are no guaranteed winners in the stock market and that success is generated by examining probabilities, not possibilities.
Symmetrical and Asymmetrical Bets
For some novice stock traders, the market can feel like a giant casino where there is glory to be had, but a potential outcome is they may lose everything the first few times they play. In the world of stock trading, one could focus on symmetric or asymmetric bets.
Symmetric bets are ones where you may risk the same amount as you could potentially win. Someone says, “I will either make $500 or lose $500 and walk away.” We feel this form of symmetry has no validity unless you increase the opportunity to win more times than you lose.
There are a variety of ways to keep losses in check while grinding out gains slowly and steadily. If you are choosing a career in trading, the foundation should be preservation of capital and learning to earn money rather than win money. Pro Traders want outcomes tilted in the direction of profits, while at the same time reducing the risk to their working capital. They don’t trade with a pure symmetry, but more with a bulge in the bell curve. This approach though is not what many today want to employ, as the goal seems to be “risk it all, go big or go home, get rich quickly.”
Asymmetric bets are the ones that capture the imagination and thrust people into the stock market. Tales of $500k returns on a single trade have people dreaming big, and while these returns are possible, they are statistically unlikely. Put simply, an asymmetric trade is where a trader risks a large percentage of their available cash or utilizes margin on their funds, so are effectively leveraged, to make an even larger return. Most likely they are not calculating the probabilities of payout, or the loss of the initial investment, but they should.
Expected Value
It is good to calculate risk to reward, but even better to use Expected Value. This formula for “expectation” considers the outcomes of probable gain and probable loss combined.
It’s not enough to think “if I invest $1000, I could make $2000” because that is just a thought of a possibility and may have no substance towards realizing that. Factoring in the probabilities of each result should help investors think about the risk that they’re willing to take to get the return.
In the above example, if the probability of winning the $2000 was 100%, it would be a no-brainer to invest the initial capital. However, if there was only a 20% chance of the return, many people would shy away from the trade. The Expected Value (EV) calculation formalizes this by multiplying the return by the possibilities and summing the outcomes for a theoretical number.
In these scenarios:
- Invest $1000
- 80% chance of losing all your money = -$800 (Theoretical loss)
- Actual Loss = -$1000 (if you actually lose)
- 20% chance of winning $2000 = $400 (Theoretical gain)
- Actual Gain = $2000 (If you actually win)
If the trader had the outcome of losing on their first investment, they would have nothing, the $1000 they had is gone. If they want to trade again…refunding account is necessary. However, if they experienced the windfall of the $2000 initially, they would now have $3000 in their account. Let’s play with that second outcome of them winning $2000 on their first trade. Now imagine they keep the bet size the same, and made a total of 10 trades where 8 of the 10 were losers and 2 of the 10 were winners:
First the theoretical:
- 8 * -$800 = -$6400
- 2 * $400 = $800
- Total = -$5600
Next the actual:
- 8 * -$1000 = -$8000
- 2 * $2000 = $4000
- Total = -$4000
You can see that the theoretical and the actual are both staggering losses. The only way cheating death works is if you are lucky enough to cheat it. Doubtful that if one persists at violating the mathematical laws, they will stay lucky forever. In trading terms, if you get lucky the first time, you will have learned nothing and will most likely continue to violate probabilities, leading to eventual ruin.
Let’s take this further into an actual trade setup.
Expected Value Trade Setup - Example
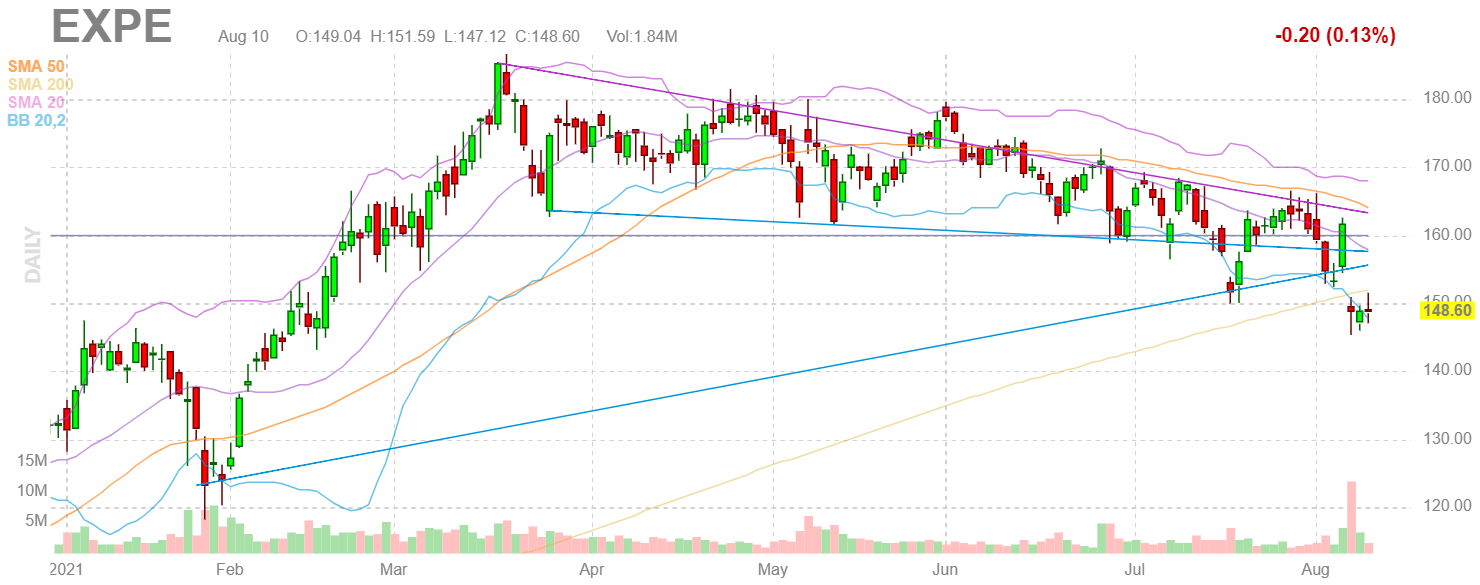
EXPE gapped down and penetrated the lower Bollinger band (BB). This lower band represents -2 Standard Deviations away from a 20-period moving average, in this case on our daily chart.
Looking at the chart you can see a few times previously that it did the same thing having a reversal back up afterwards. You can assume this is a great high probability setup or you can procure actual supporting data like the pros do. Where does one get that info? Glad you asked as here is some data from StockOdds:

Data pulled August 10, 2021 after market close.
This showcases that EXPE has had 20 such extreme events in the last 2000 days and the direction is up with an average performance of 3.28% over the next 10 days after such event.
This is something to sink your teeth into…as it takes the guesswork out of trading a signal.
Be data driven and use the web screener to find great signals and the subsequent performance afterwards.
- 3.28% of a $148.60 = $4.87
- Our Odds are 85 so we can take .85 * 4.87 = $4.14 of theoretical potential gain.
But what about the loss???
- The 3-day low was $145.40 so Last Close of $148.60 minus that low = -$3.20
As we did with potential gain, we must multiply the potential loss by the probability of that occurrence. If the Odds of going up is 85, then the Odds of going down is only 15.
- 15 * - 3.20 = -$0.48
The Expected Value of this trade then is 4.14 + (.48) = 3.66 over the next 10 days following this event.
This is a healthy probability-based approach to Asymmetric Trading. You indeed have a positive expectation for this trade. Your theoretical gain is $3.66 over 10 days from the close of August 10, 2021 until the close 10 days later.
Closing Thoughts
One can see from these exercises how valuable it is to see things through the lens of “what is the probability of making money if it goes up after I buy it versus what can I lose if it goes down after I buy it” Better than a simpler risk to reward formula, the Expected Value considers both the winning and losing scenario. StockOdds brings you the actual numbers to use for subsequent performance after a signal is generated to determine whether you have a positive expectation for the trade or not.
For those interested in a career in trading, learning these approaches, and how to benefit from predictive analytical data, check out How StockOdds Works for an in-depth look at what StockOdds can offer you in your journey to a profitable trading career.
Start Trading with Odds
Get access to the Seasonality Almanac Dashboard, as well as 1 basic course, for free!
