Trader Talk: Chip Wreck and Buying Dips
Jul 03, 2023
The following is a chat between Rob and one of the many traders he helps coach. The chat took place the morning of June 28, 2023 and takes a look at the tech sector, how to determine if there is actual strength in the economy and more.
Trader, 7:47 AM
Some observations:
1. Semis were down premarket on a negative headline. Given the strength in tech and NVDA being a market darling, this was a good buy the dip opportunity.
2. Staples were down this morning off GIS earnings. Given the fervor in the market for the tech leaders, it isn't surprising that there don't seem to be buyers waiting to buy Kraft Heinz or Smuckers on weakness. Unfortunately for me, I opted to buy some of the Staples off weakness, so I need to get better at assessing market sentiment before the fact.
3. AMZN, AAPL, MSFT, big tech names looked pretty strong premarket, suggesting rotation within tech from some of the semis into some of the megacap tech names (this was pointed out by Dennis on the PMP morning show).
Rob, 8:19 AM
You may want to subscribe to Dennis on Twitter if you don't follow him already... as he mentioned the "Chip Wreck" in the after hours yesterday.
Just a note: when you see the high signal to noise rally we had yesterday, that means there is genuine buyer interest and it was spawned by 3 good economic reports which show strength in the economy perhaps enough to weather the coming interest rate hikes without plunging us into recession (the sentiment, not my opinion).
So in that context, when you get a drop the next day, you can expect to have buyers that missed the rally yesterday...having regret...and saying today is my opportunity...so a high probability of filling the gap.. which we know there is expectation for anyway.
make sense?
absolutely
think about the "collective borg" what is the hive sentience...
don't think about your "safety" as that often has you misaligned.
Example. You see a down open...so you are thinking things are going to go down further
Instead you should think: There is discount. What symbols are most likely to be purchased at a discount that may have had regretful missing out peeps and what symbols can slingshot back up off a discount open.
There is another concept you have to hold in balance also
Those symbols that may have lagged yesterday in the risk-on category, may slingshot to the front of the pack.
I know that we had NFLX in both our Neutral List and the Risk-On List today
not by us choosing but by the Algo picking it up due to its discount yesterday but with Odds of it performing today
So you have to hold both concepts: The TSLA continuation of strength and the laggers like NFLX moving the next day
Thanks for framing that for us.. my biggest takeaway is the context of yesterday's move... move market, huge upside move the previous day, decent gap down premarket.. in comes the FOMO and up we go.
a lot of trading is pattern / scenario recognition. But you have to stay alive in the game long enough to get these different situations stored securely in your memory bank.
i understand. from my perch i witness a lot of traders struggling with high signal days, instead they should be making money from weighting capital directionally or crutch trading etc.
Rather they fight it. So the place to start is to recognize signal vs noise intraday, then expand that to longer time frames... and next, think about how one day might influence another day.
Here was SPY yesterday:
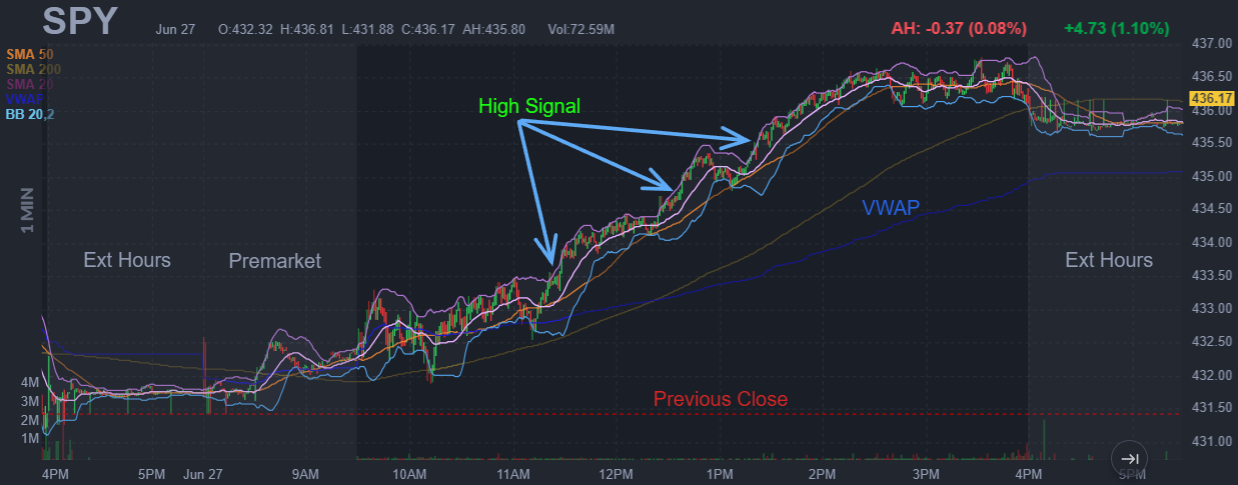
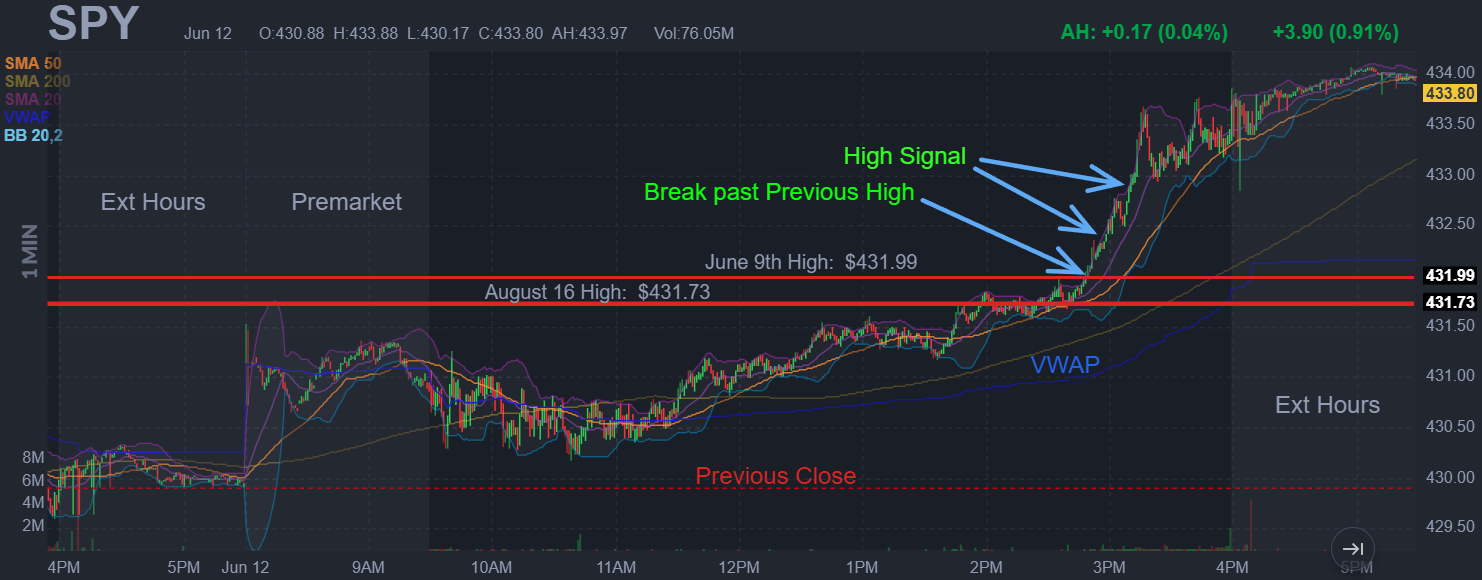
Second chart was where you have a transition at a number and high signal comes into play

If you have a day where the whole trading session is a high signal day... how soon after the open would you expect a trader be able to identify this type of day and stop looking for reversals?
June 26 we had an initial burst...but a totally different scenario from yesterday
So... leading indicators USD, VIX and then market breadth all assist in that determination
How did it do premarket? sloping up
Where is it opening relative to its PIVOT and yesterdays range?
Did it fill gap?
Where is it relative to VWAP?
How much is it pulling back?
Sentiment? From what engine? Does the engine have gas in the tank?
So yesterday...you would have known enough by the 11:30am ET 2 hour breakout
so the rest of the day was yours to take
Divide the day into seasons
Those seasons can be called whatever you want but they are:
Framed by first hour, second hour, slow-time of day, after lunch, and last hour of day
So in first hour ...look for primary trend
Second hour... continuation or reversal occuring?
Slow time... continuation or reversal occuring?
After lunch... resumption of primary trend?
Last hour... reversal???
and i have previously talked about all the key times to watch for inflection points
Framing:
Premarket highs/lows/ and slope
Premarket response to news
Open (where, how)
First 30 minutes
10am ET
10:30
11:30
12pm
1:40pm
3pm
3:30
3:45
3:50
3:55
all of those are the key times
everything in between is fluff unless it is FOMC or an economic report intraday
WY has been showing strength again. Rob can you be our leading indicator and shoot us here in the States a message when you smell smoke? :)
its simpler than that
look at your weather forecasts
1. Significant El Nino this year
2. Lack of proper Forest Management globally especially in the 2020-2021 covid lockdowns
3. Weather shows some a very hot summer with limited rain
4. Lightening strikes when there are storms but not accompanied by much rain
so expect Forest Fires to ramp up soon
which means the trade is now...not after everything is on fire
Note: June 20-23 we had rain that helped a lot of fires
But that ended and June 24 heat started again
And you can see that in the chart with the pullback during those days. Incredible.
So you do have a future that can also help
remember a future is a bit of a crystal ball into the future value of something
futures traders, especially commodities are more in-tune with Almanac, Weather, Macro
Equities Traders are actually quite "dumb" sometimes as they think it is all about a technical pattern on a chart
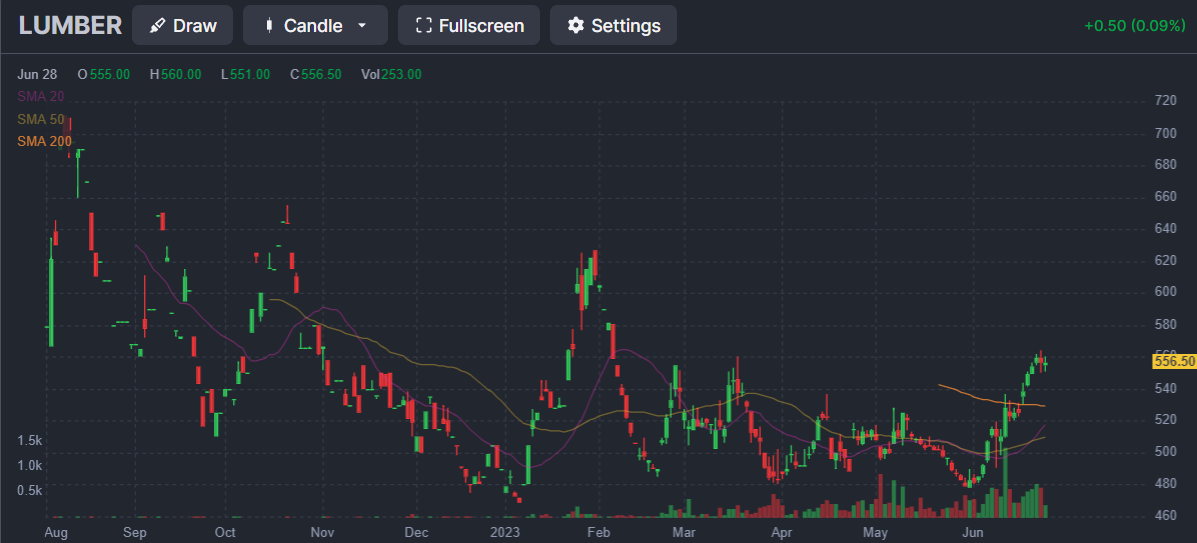
thanks for that tip.. im looking at LBR1! on trading view for Lumber futures now.
There was a season in my office one year where we just traded the Mexican Baggage Handlers publicly traded stocks by watching the Hurricane Maps. So traded them as a pair based on the Hurricane exposure on the East Coast vs West Coast of Mexico
so no one had the "stock" charts with the fancy indicators... no... we had Hurricane and Weather charts
That's fantastic! and very insightful to what needs to be going on inside a trader's head
remember i said to you previously...there is a way to be early or on-time vs late. Being late means when all of Canada is on fire...and most of the Timber is burned...then...hey I should be long WY
that is too much confirmation bias
you need to go earlier than that :)
Start Trading with Odds
Get access to the Seasonality Almanac Dashboard, as well as 1 basic course, for free!
