5 Steps to Using Pivot Structure and Improving your Trading Strategy
Jan 06, 2023
Pivot structure can be a simple yet effective indicator, to add to your repertoire of tools, that may help boost your trading framework. If you’re curious about increasing your Odds by incorporating pivot points into your system, this blog post is for you. Discover five ways to use pivot-based trading to improve your ability to make informed decisions.
Pivot points are intraday indicators that can overlay a structure or assign fences onto the next day to assist traders in qualifying reversals and trends. Generally, traders apply a pivot point strategy to equities, futures, commodities, and forex markets, using them to identify areas for entries, exits and stops. Pivot points can help traders identify where a security might experience resistance or support. Unlike moving oscillators, this static framework can be mapped onto a price chart and help with the decision tree process and IF-THEN statements traders need to create to respond to the securities action crossing or deflecting off a threshold.
Where did this Pivot Structure originate from?
This structure was originally developed by floor traders (in the human populated futures pits), and we find that although there are many versions of this, that the original formula is the most widely followed, and with that participation, the credibility of the tool remains.
Why this structure?
This forecasts a volatility framework onto the next time frame. If calculated daily, then the pivot and related support and resistance frames the next day. If weekly, then the next week, and if monthly then next month. Obviously, the longer the timeframe used, the more variables can interfere.
What is the formula?
This formula uses the previous day’s high, low, and close to calculate the Pivot (neutral point) for tomorrow:
Pivot (P) = (Previous High + Previous Low + Previous Close) / 3
Three levels of resistance are plotted above the Pivot with the notations of R1, R2, and R3. And three levels of support are plotted below the Pivot with the notations of S1, S2, and S3.
R3 = Pivot + 2 * (Yesterday’s high – Yesterday’s low)
R2 = Pivot + (Yesterday’s high – Yesterday’s low)
R1 = 2 * Pivot – Yesterday’s low
S1 = 2 * Pivot – Yesterday’s high
S2 = Pivot – (Yesterday’s high – Yesterday’s low)
S3 = Pivot – 2 * (Yesterday’s high – Yesterday’s low)
You can replace “Yesterday” with Weekly or Monthly if you wish to calculate longer term structure.
While some traders think pivot structure to be too basic of an indicator, there are ways to make these points work for you.
-
Choose your market
As mentioned, pivot points are used in different trading strategies, from a 24-hour forex market to day trading. The market you trade in will determine the timeframe for calculating your pivot points.
Calculate pivot points using the day’s high, low, and close for stocks that trade during a specific time-period. For a 24-hour stock, such as in a forex market, traders often calculate pivot points using the day’s close at 11:59 GMT while equities traders use 4 pm ET on the New York market.
Are you a day trader, or are you working on a 24-hour clock?
Make sure your timeframe is selected and move on to the next step:
-
Calculate Pivot Points
You can calculate the pivot points with the aforementioned formula easily in excel or google sheets. You can also acquire pivot points for most US Listed Equities from the download of the CSV file from the StockOdds Web Screener (called the “SSF” file)
-
Plotting Pivot Structure on Charts
Some charting services already have the Pivot Point Indicator to make it easy to apply to a chart. Although many Trader’s love having lines visible on charts, others track everything in spreadsheets, rarely looking at charts. Here is an example of how pivot structure on a chart can appear:
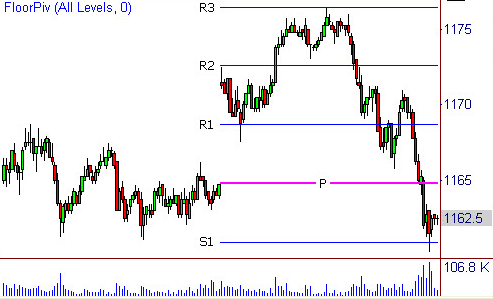
You can observe the price action moving within the various levels. We make decisions at or through these levels, which is very different than the noise between levels. We recommend not making speculative decisions in the noise areas between levels.
- Overall Trend
The day can present a bullish nature if the stock price moves upward and through the pivot and through resistance levels. The day might have a bearish bias if the stock price crosses below the pivot and through the support levels.
- When to Enter and Exit
To go long, traders may place stop buy orders above resistance levels that execute once the stock reaches those plot points. To short they can place stop sells below the support levels indicated by the calculated points. The process can be used for placing stop loss orders.
-
Plan in Advance
Thanks to the pivot point and calculated resistance and support levels being static, and projected onto the next day, week or month, this framework allows traders to plan their trades in advance. Utilizing the StockOdds Web Screener, the Trader can curate highly advantaged trades based on the subsequent outcomes when Pivots are moving up or down in a daily streak. The Trader can choose various output timeframes and have the Odds, Average Performance and Sharpe Ratio as the expectation of what can transpire. The screener shows daily data for which stocks have continued to streak above or below their pivots, along with what is statistically likely to happen in the next timeframe of your choosing.
-
Incorporate into a complete trading plan
As always, no indicator is a sure thing. If a trader wants to increase their Odds, they should build a trading plan incorporating several indicators to help make the best trades possible. Having a quantifiable edge through probability-based trading is recommended, which is made easier through StockOdds Data. You can also include moving averages, ATRs, as well as identifying various candlestick patterns which can all help to compliment your pivot point strategy. For example, if a pivot point overlaps with a 50 or 200-period MA, you may be more confident in your support or resistance level.
We have a variety of conditions on our StockOdds Web Screener that can help boost your Odds and plenty of learning tools to strengthen your skills as a trader — whether you’re a seasoned professional or trading from home. Check out the StockOdds blog to discover more tools to pair your pivot point strategy with.
Start Trading with Odds
Get access to the Seasonality Almanac Dashboard, as well as 1 basic course, for free!
