Learn to Use the Harami Cross Pattern & Improve Your Trading Odds
Aug 01, 2022
Every trader has seen the charts with different colored bars and lines — but what do they mean as a pattern, and how can you, the astute trader, use them to boost your Odds? As it turns out, there’s a lot more to them than meets the eye. Let’s look at these bars and a specific trading strategy (one of many!) generally used for technical analysis: The Harami Cross Pattern.
The Candlesticks
To start, let’s share a brief overview of the colored bars. These are called candlesticks, which are a type of price chart indicating the opening and closing prices and the highs and lows of a selected time period. Japanese rice merchants originally used this price chart to track market prices hundreds of years ago. When you follow a security for those aspects over time, it builds a chart and is known as candlestick charting, or sometimes Japanese Candlesticks. If you find the bodies confusing, there’s a trick for that. They’re also color-coded. If a candlestick is red or black, the closing price was lower than the open. If it’s green or white, the closing price was higher.
Here’s a diagram from Investopedia to lay it out:

Of course, the aspects that go into the candlestick — open, close, high, and low — will change the body’s appearance. There’s a lot of information you can pull from a quick peek, but of course, candlestick charting alone isn’t a completely reliable method. That’s why traders use strategies such as the Harami Cross Pattern to up their trading Odds.
The Harami Cross Pattern
The Harami Cross Pattern actually has two parts, the first being a larger, main candlestick like we talked about above. The second part of the Harami Cross Pattern is a smaller candlestick known as a doji. The doji is wholly contained within the body of the big candlestick and appears when the high and closing prices are similar. It often appears as a small cross, hence the name of the trading strategy. Doji’s are an indication of indecision in the security, or the potential end to a recent trend. While the color of the doji is less critical, it can indicate either a bullish or a bearish reversal depending on where in the trend it pops up. These are technician’s beliefs, but later in this article, we are going to contrast the perception/belief/understanding against a data driven probability-based approach.
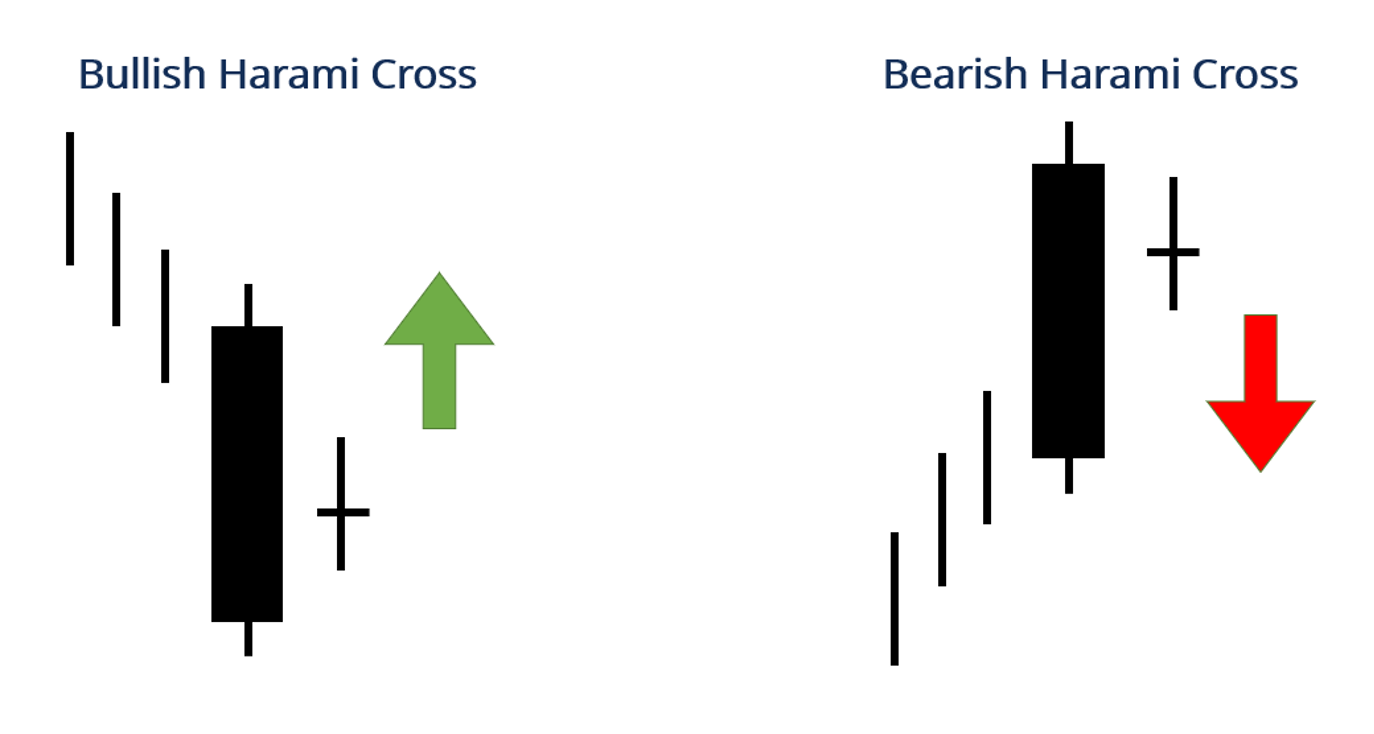
Here’s how technicians view the candlesticks that develop:
- Suppose there’s a downtrend in the market (black or red candlesticks), and a Doji — whose body is entirely contained by the candlestick — appears near the bottom. In that case, there could be some indecision amongst the sellers, meaning there’s potential for an impending reversal. This is known as a Bullish Harami Cross.
- The same comes into effect with uptrends, which would have green or white candlesticks, followed by a Doji, creating a Bearish Harami Cross.
- When the Doji indicates a potential reversal, traders will wait for additional confirmation of a price action breaking out from the Doji high or low. They also may compliment their IF-THEN statements with other indicators.
Source: Corporate Finance Institute
Taking the Harami Cross Pattern to the Next Level
Here is a better approach than simply believing that a candlestick pattern has merit on its own. Let’s see what is believed, then what is predicted by StockOdds in relationship to that set-up, then what happened next.
StockOdds Webscreener from July 7 with subsequent Odds and Average Performance for Open to Close trading for symbol BLMN for July 8, 2022.
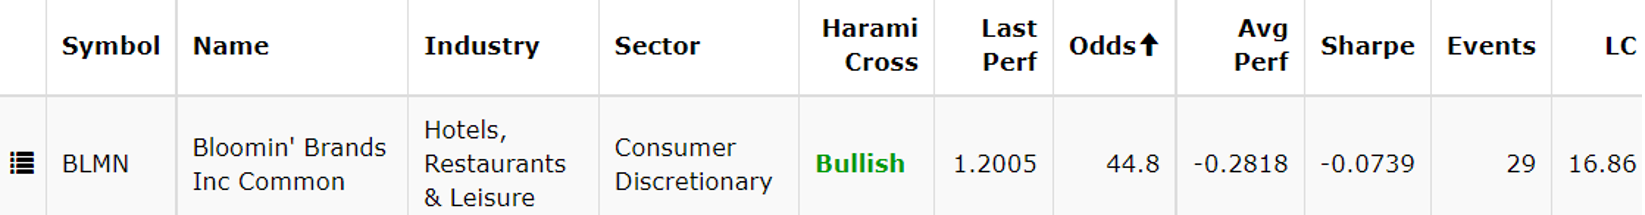
This reveals that the pattern that has been identified is the Harami Cross and is a Bullish Pattern. StockOdds is NOT saying that the outcome will be bullish, but it is analyzing this particular pattern and how many times this has come up in that stock’s activity over the last 2000 trading days. 29 times as revealed by the 29 Events.
The average outcome for the following day from the Open to the Close is -0.2818%. It has only 44.8 Odds of being up for the day session. We generally consider that Odds of greater than 50 with positive average performance and positive sharpe is bullish while Odds less than 50 with corresponding negative average performance and negative sharpe is bearish.
So although this Harami Cross pattern was labelled Bullish according to Technicians, the actual probabilities according to StockOdds data is for a down session.
Let’s see what the stock did on July 8th following this signal:
Stock Open: 16.88, Stock Close: 16.65, Down -1.36% from Open to Close
Obviously, this is only one sample but drives home the point that over 29 samples of the same Bullish pattern, the actual outcome the next day is anything but Bullish, but rather Bearish.
With StockOdds Dashboards and the Web Screener, you can view stocks in light of your favorite indicators and utilize for yourself the Odds and Average Performance plus other metrics on what tends to happen AFTER the signal. StockOdds is a worthwhile investment for traders who want to add Data Driven trading tools to their traders toolchest. Investors can benefit through StockOdds insights on longer timeframes.
Start Trading with Odds
Get access to the Seasonality Almanac Dashboard, as well as 1 basic course, for free!
