Understanding Mean Reversion: Strategies for Trading
May 27, 2023
What is Mean Reversion?
Mean reversion is a theory used in finance that suggests asset prices and returns eventually reverts to their long-term mean or average.To put in similar terms, mean reversion can be understood as “Returning to the Average” in a broad sense.This concept assumes there is an underlying stable trend in the price of a particular asset or group of assets and that prices fluctuate randomly around this trend.
In the context of the stock market, mean reversion implies stocks that have performed well over a certain period are likely to perform poorly in the future, and conversely, stocks that have performed poorly are likely to perform well in the future. The idea is price deviations from the longer-term trend are temporary and will eventually correct or "revert." This applies to many periods of time, whether it be intraday or over many years.
For traders, mean reversion strategies can provide clear guidelines for entry and exit points. When a stock deviates significantly from a given average, for example by 1 full ATR, a trader can decide to enter the trade, expecting the stock to revert to its mean. Similarly, when the stock reverts to its average, the trader can decide to exit the trade, realizing their profits. Mean reversion strategies can also be effective in both rising and falling markets, but can be often most effective in choppy markets, thereby offering opportunities to profit in different market conditions. However, like all trading strategies, mean reversion requires careful analysis and risk management. It's also important to note that past performance is not necessarily indicative of future results, and stocks may not always revert to the mean.
Using Technical Indicators to Spot Mean Reversion
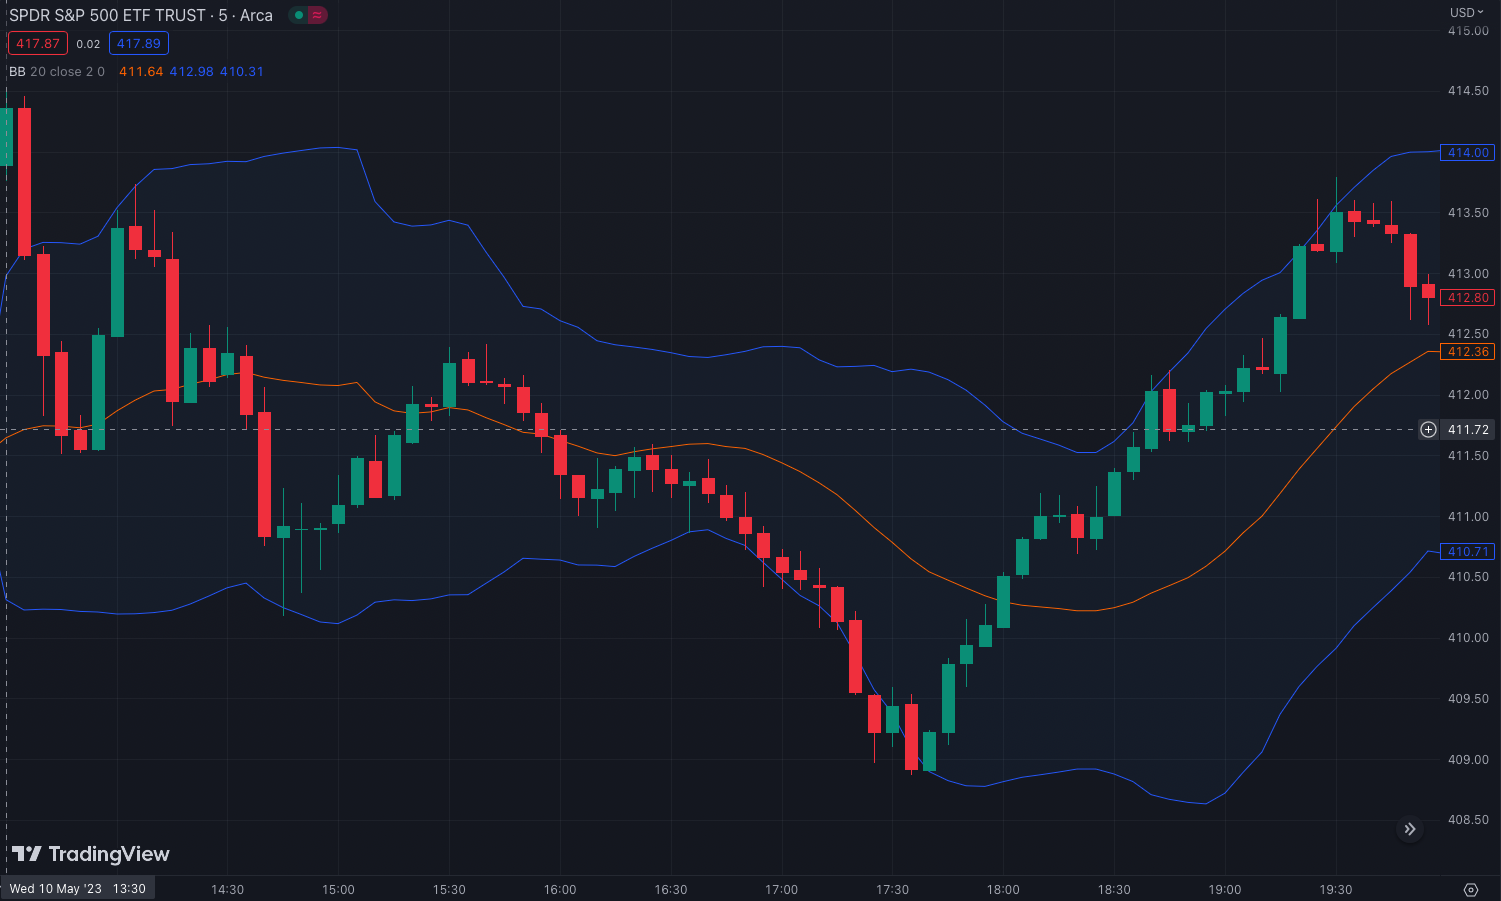
One way to better visualize an example of mean reversion is by using Bollinger Bands. In the above SPY chart, the price can be seen moving about the SMA (middle of the bands), as well as penetrating the lower and upper bands at different times during the day.
When the price of a stock (or another asset) reaches or crosses the upper Bollinger Band, it may be considered overbought. This means the price is significantly higher than its recent average, and it might revert to the mean. In this case, a trader might consider selling the stock or entering a short position. Conversely, when the price reaches or crosses the lower Bollinger Band, it may be considered oversold. The price is significantly lower than its recent average, and it might revert to the mean. In this case, a trader might consider buying the stock or entering a long position.
Mean Reversion Assets
Mean reversion can be observed in nearly any asset class. In addition to individual stocks and ETFs, here are a few examples of where mean reversion can be found:
- Commodities: Commodities such as oil, gold, and agricultural products often exhibit mean reversion. This can sometimes be caused by supply and demand dynamics, which tend to be cyclical. For example, if the price of a commodity like oil rises significantly due to a temporary supply disruption, it may eventually revert to its long-term average once the supply issue is resolved.
- Currencies: In the forex market, currency pairs can exhibit mean reversion over certain timeframes. This can be because exchange rates are being influenced by a range of factors including interest rates, inflation, and economic performance, which can cause temporary deviations from long-term trends.
- Interest Rates: Interest rates, and by extension, bond prices, can also demonstrate mean reversion. Central banks adjust interest rates in response to economic conditions, and these changes can cause temporary fluctuations in bond prices. However, over the long term, rates and prices may revert to their mean.
- Value vs. Growth Stocks: In the equity markets, "value" stocks, or those that are seen as undervalued compared to their intrinsic value, can be subject to mean reversion. The theory is the market will eventually recognize the company's true value, causing the stock price to revert to the mean. This can be compared to growth stocks, which can often “become disconnected” from the market, rising in price despite poor fundamentals. The theory here is the market will eventually correct itself, and the stock will revert to its lower mean.
- Pair Trading: Pairs trading can take advantage of mean reversion by identifying two historically correlated assets that have diverged from their usual relationship. We’ll get more into this below.
Pair Trading
Pair trading involves identifying two stocks that move together based on historical correlation and creating a market-neutral strategy by buying one stock (the underperformer) and selling the other (the outperformer). The idea here is if these two stocks have deviated from their historical norm, they will eventually revert to that norm.
Here's a simplified example: If Company A and Company B are historically correlated, but Company A's stock price has recently gone up while Company B's has gone down, a pair trader would assume this deviation from the norm is temporary. They would then short Company A (betting its price will go down) and go long on Company B (betting its price will go up), expecting the prices will revert to their historical correlation.
More specifically, we can look at Under Armour, which has two classes of stock listed on US exchanges, UA and UAA. Let’s take a look at its pair ratio chart, UA/UAA below.
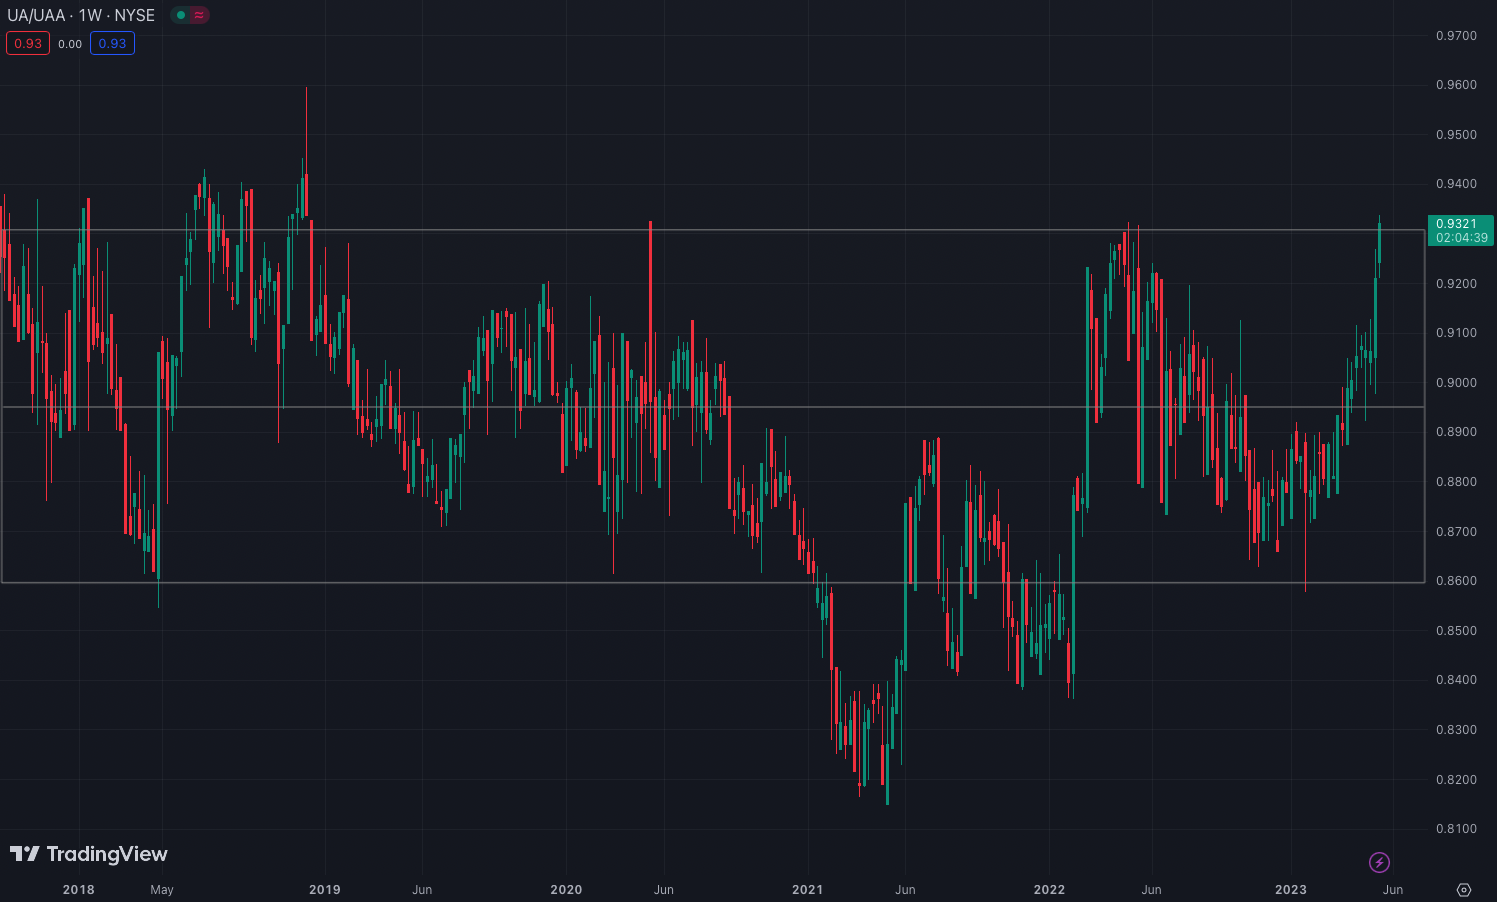
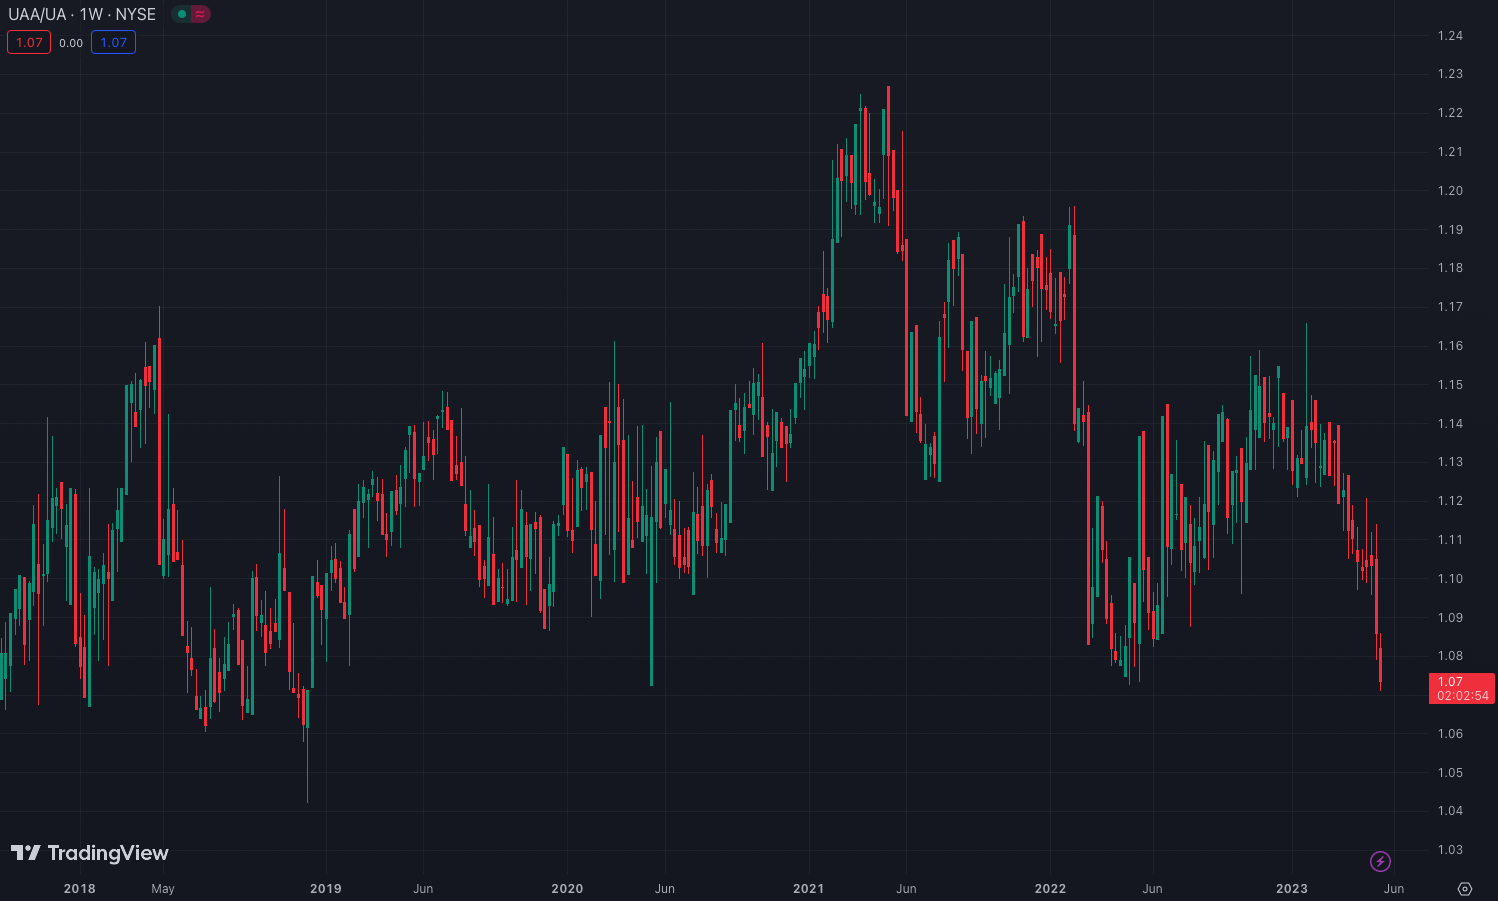
If the current ratio of UA to UAA is 0.93, and a trader wants to bet the pair will revert to its mean, somewhere around 0.895, one could long UAA and short UA stock, creating a market-neutral pair. For a comparison, the reversed chart looks like the following:
Pair trading can be a good way to take advantage of mean reversion while also minimizing exposure to market risk, as the strategy doesn't rely on the overall market direction. Instead, it relies on the relative performance of the two stocks. However, like all trading strategies, it's not without its risks, and it requires careful analysis and monitoring.
Boosting Mean Reversion Strategies with Odds
Traders can use mean reversion in combination with statistical analysis to enhance their trading strategy. The concept of "Odds" here refers to the statistical likelihood of an event occurring, based on historical data.
In the context of stock trading, this could mean looking at the past performance of a stock or a pair of stocks, and calculating the odds of that stock or pair reverting to its mean. For instance, if a particular stock has shown a tendency to revert to its mean 65% of the time after a significant price move over 5 days, a trader could consider this a favorable odds scenario for a mean reversion trade.
In the recent case study, a day trading strategy was based on a "Top 10 Odds" list, consisting only of symbols within the S&P 500. Each day, 10 stocks that were statistically advantaged (i.e., likely to rise based on historical data) were bought, and 10 stocks that were statistically disadvantaged (i.e., likely to fall based on historical data) were sold. This approach created a hedged basket of 20 total stocks each day. Using this strategy, a 10:1 leverage was used on the initial capital, yielding +54% in 49 days, translating to an average yearly return of approximately 275%. This essentially works on similar principles to mean reversion in a pairs trade, but with multiple stocks at a time on both the long and short side.
This approach illustrates the power of combining the principles of mean reversion and statistical probabilities. By understanding the historical behavior of stocks and using statistical Odds to identify potential trades, a trader can potentially increase their own odds of better returns.
In Summary
Strategies such as mean reversion, paired with tools like Bollinger Bands and specifically the statistical Odds on what the outcomes over various time-frames can be, after touching or penetrating a Bollinger Band. This combination provides valuable insights into market dynamics and potential trading opportunities. Yet, it's crucial to remember that no single strategy guarantees success in every situation.
The markets are dynamic and continually evolving, influenced by a myriad of factors ranging from economic data releases to geopolitical events. As such, a strategy that works well under certain market conditions might not perform as expected under others. Therefore, continuous learning and experimentation with different strategies are essential to staying ahead of the curve and improving your trading performance.
In the world of trading, every day is a new opportunity to learn something new. Embrace the process, stay curious, and always strive to improve. The path to trading success is a marathon, not a sprint, and every step taken in learning and experimentation is a step forward on this exciting journey. Happy trading!
Start Trading with Odds
Get access to the Seasonality Almanac Dashboard, as well as 1 basic course, for free!
