The Top 3 Technical Indicators New Traders Should Learn
Mar 28, 2023
Anyone can step into trading, but it takes much more than just being lucky to succeed at it. Technical pattern analysis can give you the edge in the market that you need to stop playing guessing games and start making entries and exits with higher odds. If you’re new to the game and want a strong start, here are three technical indicators you should learn to use to your advantage.
-
Moving Averages
Moving averages (MA) are a popular technical indicator that helps traders determine the market’s overall trend. It shows the average price of an asset over a specified period. 50-days and 200-days are closely followed timeframes by seasoned traders, but you can select whatever time frame suits your goals. MA is known as a “lagging” indicator, but don’t let that throw you off! It’s only because it functions using past data (something you have plenty of access to with our Odds Data!). The longer your selected period, the longer it lags. When the average rises, you can guess your chosen asset is on an upward trend. When it’s going down, the opposite could be true.
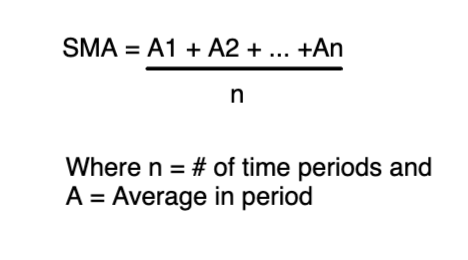
There are two kinds of moving averages, simple and exponential. The following formula calculates a simple moving average:
Exponential moving averages give more weight to recent prices to give you more up-to-date information on the current trend. It looks like this:

It may look and feel complicated, but what you really need to know about MA is that traders look at the average price of an asset in different time frames to determine whether it is trending up or down. Some moving averages can then serve as support or resistance levels as well, with the most significant being a 200-day SMA. These levels can serve as the point of decision on whether to exit or enter a trade, as other traders and investors may be looking to enter/exit trades at that price area. It is important to note that many newer traders may think that because a moving average has turned up, that the stock will continue to rise. We find many examples historically of the stock mean-reverting (pulling back) to its moving average. If you want to see some examples for yourself, use the StockOdds Webscreener and query for stocks that have streaked up or down directionally for 5, 6 or 7 days and observe them for a while after that. You will often witness the retracement back to a moving average, like the 20-day or 50-day SMA. StockOdds will in fact assist you by giving you the Odds and Average Performance expectancies for 3, 5, 10 or 20-days out from that streak event.
-
Candlestick Patterns
Candlestick patterns are a visual representation of price action on a chart. They are composed of a body, shadow, and wick, and each pattern provides information about the market sentiment and momentum. Some of the most popular candlestick patterns for novice traders include the hammer, the doji, and the bullish engulfing pattern. By understanding these patterns, new traders can identify potential entry and exit points for their trades. If you want to up your Odds by using Candlestick patterns, our StockOdds Webscreener offers numerous conditions that you can hone your pattern-reading eye with, including doji star, engulfing patterns, and the hammer. If you’re interested in exploring the StockOdds Webscreener, you can book a meeting to see if you qualify here.
Check out our blog if you want to learn the specifics of different candlestick patterns and how to read them! You’ll find plenty of resources, such as this one about understanding engulfing patterns.
-
Bollinger Bands
The third indicator we think every beginner trader should learn about is Bollinger Bands (BB). This is a technical indicator that helps traders identify market volatility. It consists of a moving average in the middle and two standard deviation lines above and below it. The upper and lower bands expand when the market is volatile and contract when it is less volatile. BB indicators actually use moving averages from above to build an understanding of the market and what might happen next. Understanding the market’s volatility can help you determine the surrounding market conditions and up your Odds in making informed trading decisions. StockOdds showcases percent proximity to the upper and lower Bollinger Bands based on two Standard Deviations from your choice of a 20-period or 50-period SMA.
To learn a few strategies that use BB and to get a better grasp on market volatility, check out this in-depth blog post about Bollinger Bands and how to use them.
While there are numerous strategies and technical indicators in the trading realm, these three offer new traders an opportunity to boost their Odds strategically without getting lost in complicated analysis right off the bat. However, the biggest lesson we tell any trader is always to use more than one indicator, as no trade is ever a sure thing. By signing up for StockOdds Data and the Webscreener, you have access to numerous conditions and educational tools with which you can build your technical analysis skills and start boosting your Odds of making good trades. We even take it a step further, and provide an extra level of analysis for technical indicators: the Odds and Average (Expected) Performance that typically follows a given indicator value. This unlocks a quantitative edge by adding statistics to your toolbox. And if you don’t want to dive deep into the statistics, you can try our new Top 10 Odds list! We curate top stock expectations (backed by real-world data) every day, week and month, and deliver the Top Odds straight to your inbox in the morning.
Start Trading with Odds
Get access to the Seasonality Almanac Dashboard, as well as 1 basic course, for free!
