How to Read Engulfing Patterns
Nov 15, 2022
Candlestick trading is a hot topic for at-home and professional traders! One type of strategy it can help with is identifying potential reversals in the market and with your chosen securities. Luckily, when it comes to candlestick trading, there are several patterns to look for that can be identified using the data conditions within our Web Screener. One of those patterns is called an engulfing pattern. Let’s take a look at what that means!
What is an engulfing pattern?
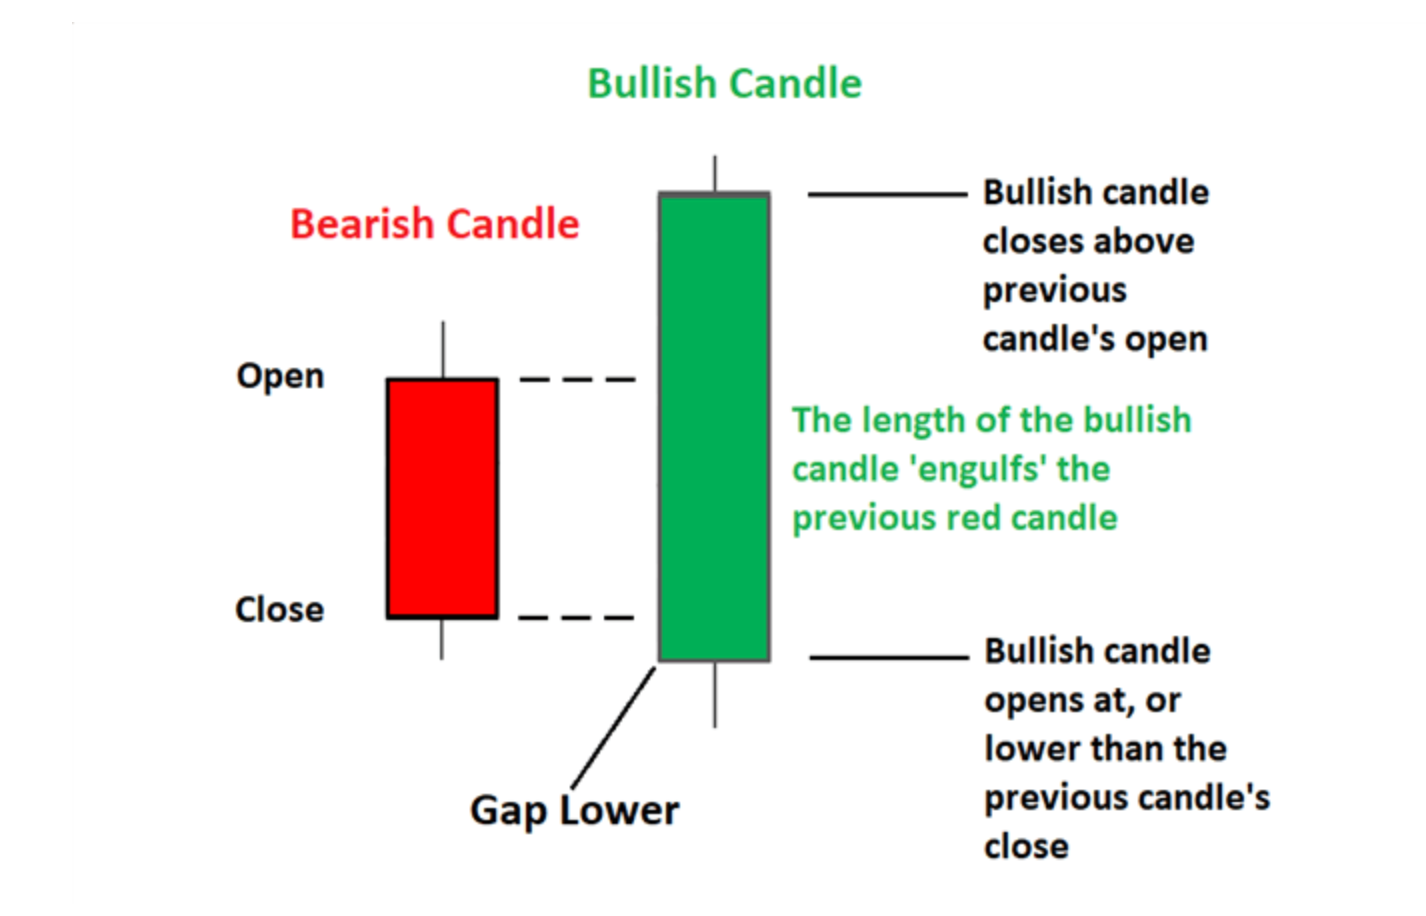
An engulfing pattern is signified by a large candle immediately following a small candle — it effectively “engulfs” the previous candle. Where the pattern forms in the current trend can indicate a reversal in the market. Like many patterns in trading, the indicator can either be bullish or bearish. DailyFX gives two other areas where an engulfing pattern can be useful to traders:
- Trend continuation
- Exit strategies
Not every engulfing pattern will be an accurate indicator of a market change. As always, we suggest looking at the larger picture and overall pattern over different periods and in conjunction with other indicators and strategies. It’s also helpful to understand the accuracy of candlestick trading beforehand.
Bullish Engulfing Patterns
When looking at bullish engulfing patterns, you’re looking at downtrends where a larger, hollow or green candle engulfs a solid or red candle. To form the green candle, the opening price of day two will be a lower price than what it closed at on day one before ultimately closing at a price higher than it opened at on day one, thus creating a candlestick larger than the previous one.
The trick with these patterns is to look at the preceding candlesticks to gain that context of how it arrived at this pattern, and if you want to wait before making a decision, watch the next bar to gauge the stock's direction. Many traders wait that extra day for confirmation. Traders can also look at the trading volume of a particular security with an indicator such as an MFI to help determine the strength of the pattern’s signal.
Bearish Engulfing Patterns
Bearish engulfing patterns are the opposite. A smaller white, hollow or green candle is engulfed by a solid or red one, indicating a potential decrease in price. It is a more significant indicator if this pattern appears after a price advance.
With these patterns, the size of the candlesticks matter. Small candlesticks represent a less strong signal as opposed to larger ones. Because the pattern is simple and can occur under many different conditions, the most critical step in using this candlestick trading pattern is to verify it with other methods and to look at the pattern over time. Luckily, we have plenty of historical data with which you can observe your security’s patterns and changes over time.
Trends Over Time
Engulfing patterns don’t always occur at the end of a trend. That’s why they can also be used to identify a continuation or continued momentum of the current trend of the security. Depending on the next few candlesticks or subsequent price action after the signal, the pattern will either be validated or not.
Supercharging Engulfing Patterns
While nuanced, an engulfing pattern can be a helpful tool when the pieces come together to validate it. However, a trader needs to be savvy when looking for the signs of a candlestick pattern! Of course, those signs can be reinforced, and your Odds will be boosted by utilizing tools such as our Web Screener to find out the Odds and Average Performance of an engulfing pattern playing out. This is a critical component to being probability informed: When your stock or ETF displays an Engulfing Pattern, which way does it travel next and by how much on average? Let StockOdds be your resource for that information. View an example of how StockOdds can help here. Plus, you can combine the Odds of a pattern such as this with other indicators in our Web Screener, such as RSI or %BB. If you’re curious about how our system works, watch this video. StockOdds can help makes you a better trader by providing you with the information and data to fortify your decisions.
Start Trading with Odds
Get access to the Seasonality Almanac Dashboard, as well as 1 basic course, for free!
