Understanding MFIs and How to Use Them
Jul 14, 2022
There are plenty of common momentum indicators that focus on oscillation, such as RSI. Now, it’s time to wade a little deeper into the indicator world and take a peek at MFIs — short for Money Flow Index — which are like your traditional RSI but with a twist. They consider volume to help interpret a security’s movement.
“Demand is measured in volume and thus volume must precede price.” — Joe Granville
The Basics
MFIs were introduced by Gene Quong and Avrum Soudack as a leading tool with a better knack for predicting reversals and divergences. Thanks to how the formula works, MFIs manage to highlight differences between price perception and the real strength of a trend, making it a little easier for traders to trust in an impending reversal or divergence. They also help investors recognize when a trend pullback might be coming to an end!
Here’s how it works:
MFIs are calculated on a scale from 0-100, just like most momentum indicators. Anything above 80 is typically considered a sell signal, and anything below 20 is typically a buy signal. Traders can also look at the 50 mark, where calculations above suggest buying pressure exists in the market, whereas below suggests selling pressure.
A typical period for an MFI calculation is 14 days. With StockOdds, you can adjust your Web Screener for 5, 14, or 28-day period calculations for better Odds and a deeper understanding of the market trends. Instead of just relying on an MFI value of above 80 to signal a long trade, Odds are available on how many times that MFI value actually worked as a buy signal in your defined lookback period, as well as vice versa for sell signals.
To calculate MFIs, traders look at the typical price of a security compared to the money flow and volume of that money flow over a selected period. It sounds complicated, but it’s really just a series of formulas traders plug information into, then capture a final reading.
The Formulas
As mentioned above, traders need a few things to calculate an MFI.
Typical Price
The typical price is the average of the high, low, and close prices for your period.

This incidentally is the same formula to calculate the Pivot for next trading day. Pivots tend to stabilize data and can reveal staircase-like shifts in volatility or the absence of it day-to-day.
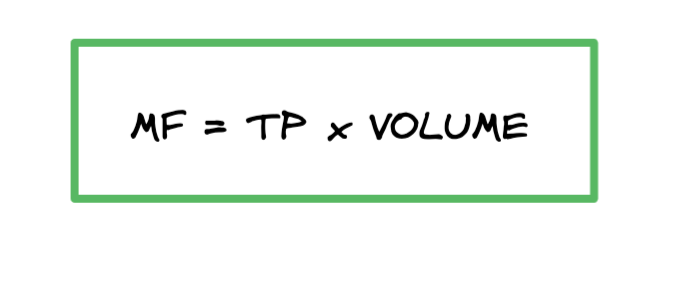
Money Flow
Money flow (MF) can be positive or negative depending on the movement and is the typical price multiplied by the volume of the movement. If the price drops for that period, the money flow will be negative, and if it goes up, it will be positive.
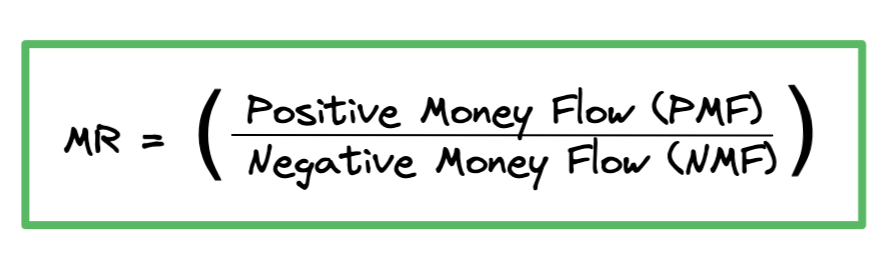
Money Ratio
The money ratio (MR) is the ratio of positive and negative money flow.
Money Flow Index
Finally, the money flow index is a number between 0-100 using the above components to indicate true security movement via the volume.

If you want to calculate MFIs by hand, Investopedia suggests using a spreadsheet and these step-by-step instructions. Here at StockOdds, we suggest plugging your parameters into our Web Screener and dashboards and letting the system do the work for you! That way, you can monitor various securities under various conditions simultaneously and compare them with other indicators to up your Odds.
How Traders Use MFIs
There are three things traders generally use MFIs to indicate: divergences, overbought and oversold conditions, and trend pullbacks.
Divergences
Like most momentum indicators, MFIs indicate a potential reversal when the indicator starts moving in the opposite direction of the security’s price. If the price goes down, but your indicator is going up, a bullish divergence is being signaled. Sell pressure is starting to wane off, and it’ll be time for the buyers to take back over. When the opposite is true: the price goes up, but the indicator is going down, it’s a bearish divergence. Selling time is nigh! Bearish divergences are a great time to think about placing a short sale order.
Overbought and Oversold
Overbought and oversold are where those 20/80 numbers come into play. Traders use this strategy to try and predict and stay on top of market reversals to let them know when to buy and sell.
Trend Pullbacks
For trend pullbacks, traders look for “waves” in their indicators. The waves generally show successive highs or successive lows that let the savvy trader know a trend is coming to an end. If you see, for example, a security price bump up to $20, then return to $18, and then bump back up to $25, the low trend could be reversing in favor of being a little more bullish.
Combining MFI with Odds
While MFIs have their place and many traders find them to be excellent momentum indicators, they have their cons, too. The best traders tend to use multiple tools, like what we offer at StockOdds, to make sure their predictions are as accurate as possible when it comes to making a trade. StockOdds reveals the subsequent Odds and Average Performance behavioural tendencies after MFI showcases a number, which is so much better than just the number itself. Be probability-based, combine data signals as well as your market observations. We also encourage you to find out the best counterparts to an MFI and never rely on a single signal!
Start Trading with Odds
Get access to the Seasonality Almanac Dashboard, as well as 1 basic course, for free!
